Races in Oak Hills, Oregon (OR) Detailed Stats
Data:
Races - White alone (%)
Races - White alone (% change since 2000)
Races - Black alone (%)
Races - Black alone (% change since 2000)
Races - American Indian alone (%)
Races - American Indian alone (% change since 2000)
Races - Asian alone (%)
Races - Asian alone (% change since 2000)
Races - Hispanic (%)
Races - Hispanic (% change since 2000)
Races - Native Hawaiian and Other Pacific Islander alone (%)
Races - Native Hawaiian and Other Pacific Islander alone (% change since 2000)
Races - Two or more races(%)
Races - Two or more races(% change since 2000)
Races - Other race alone (%)
Races - Other race alone (% change since 2000)
Racial diversity
Place of birth - Born in state of residence (%)
Place of birth - Born in state of residence (%) - White
Place of birth - Born in state of residence (%) - Black or African American
Place of birth - Born in state of residence (%) - Asian
Place of birth - Born in state of residence (%) - Hispanic or Latino
Place of birth - Born in state of residence (%) - American Indian and Alaska Native
Place of birth - Born in state of residence (%) - Multirace
Place of birth - Born in state of residence (%) - Other Race
Place of birth - Born in other state (%)
Place of birth - Born in other state (%) - White
Place of birth - Born in other state (%) - Black or African American
Place of birth - Born in other state (%) - Asian
Place of birth - Born in other state (%) - Hispanic or Latino
Place of birth - Born in other state (%) - American Indian and Alaska Native
Place of birth - Born in other state (%) - Multirace
Place of birth - Born in other state (%) - Other Race
Place of birth - Native, outside of US (%)
Place of birth - Native, outside of US (%) - White
Place of birth - Native, outside of US (%) - Black or African American
Place of birth - Native, outside of US (%) - Asian
Place of birth - Native, outside of US (%) - Hispanic or Latino
Place of birth - Native, outside of US (%) - American Indian and Alaska Native
Place of birth - Native, outside of US (%) - Multirace
Place of birth - Native, outside of US (%) - Other Race
Place of birth - Foreign born (%)
Place of birth - Foreign born (%) - White
Place of birth - Foreign born (%) - Black or African American
Place of birth - Foreign born (%) - Asian
Place of birth - Foreign born (%) - Hispanic or Latino
Place of birth - Foreign born (%) - American Indian and Alaska Native
Place of birth - Foreign born (%) - Multirace
Place of birth - Foreign born (%) - Other Race
Residents speaking English at home (%)
Residents speaking English at home - Born in the United States (%)
Residents speaking English at home - Native, born elsewhere (%)
Residents speaking English at home - Foreign born (%)
Residents speaking Spanish at home (%)
Residents speaking Spanish at home - Born in the United States (%)
Residents speaking Spanish at home - Native, born elsewhere (%)
Residents speaking Spanish at home - Foreign born (%)
Residents speaking other language at home (%)
Residents speaking other language at home - Born in the United States (%)
Residents speaking other language at home - Native, born elsewhere (%)
Residents speaking other language at home - Foreign born (%)
Marital status - Never married (%)
Marital status - Now married (%)
Marital status - Separated (%)
Marital status - Widowed (%)
Marital status - Divorced (%)
Ancestries Reported - Arab (%)
Ancestries Reported - Czech (%)
Ancestries Reported - Danish (%)
Ancestries Reported - Dutch (%)
Ancestries Reported - English (%)
Ancestries Reported - French (%)
Ancestries Reported - French Canadian (%)
Ancestries Reported - German (%)
Ancestries Reported - Greek (%)
Ancestries Reported - Hungarian (%)
Ancestries Reported - Irish (%)
Ancestries Reported - Italian (%)
Ancestries Reported - Lithuanian (%)
Ancestries Reported - Norwegian (%)
Ancestries Reported - Polish (%)
Ancestries Reported - Portuguese (%)
Ancestries Reported - Russian (%)
Ancestries Reported - Scotch-Irish (%)
Ancestries Reported - Scottish (%)
Ancestries Reported - Slovak (%)
Ancestries Reported - Subsaharan African (%)
Ancestries Reported - Swedish (%)
Ancestries Reported - Swiss (%)
Ancestries Reported - Ukrainian (%)
Ancestries Reported - United States (%)
Ancestries Reported - Welsh (%)
Ancestries Reported - West Indian (%)
Ancestries Reported - Other (%)
Geographical mobility - Same house 1 year ago (%)
Geographical mobility - Same house 1 year ago (%) - White
Geographical mobility - Same house 1 year ago (%) - Black or African American
Geographical mobility - Same house 1 year ago (%) - Asian
Geographical mobility - Same house 1 year ago (%) - Hispanic or Latino
Geographical mobility - Same house 1 year ago (%) - American Indian and Alaska Native
Geographical mobility - Same house 1 year ago (%) - Multirace
Geographical mobility - Same house 1 year ago (%) - Other Race
Geographical mobility - Moved within same county (%)
Geographical mobility - Moved within same county (%) - White
Geographical mobility - Moved within same county (%) - Black or African American
Geographical mobility - Moved within same county (%) - Asian
Geographical mobility - Moved within same county (%) - Hispanic or Latino
Geographical mobility - Moved within same county (%) - American Indian and Alaska Native
Geographical mobility - Moved within same county (%) - Multirace
Geographical mobility - Moved within same county (%) - Other Race
Geographical mobility - Moved from different county within same state (%)
Geographical mobility - Moved from different county within same state (%) - White
Geographical mobility - Moved from different county within same state (%) - Black or African American
Geographical mobility - Moved from different county within same state (%) - Asian
Geographical mobility - Moved from different county within same state (%) - Hispanic or Latino
Geographical mobility - Moved from different county within same state (%) - American Indian and Alaska Native
Geographical mobility - Moved from different county within same state (%) - Multirace
Geographical mobility - Moved from different county within same state (%) - Other Race
Geographical mobility - Moved from different state (%)
Geographical mobility - Moved from different state (%) - White
Geographical mobility - Moved from different state (%) - Black or African American
Geographical mobility - Moved from different state (%) - Asian
Geographical mobility - Moved from different state (%) - Hispanic or Latino
Geographical mobility - Moved from different state (%) - American Indian and Alaska Native
Geographical mobility - Moved from different state (%) - Multirace
Geographical mobility - Moved from different state (%) - Other Race
Geographical mobility - Moved from abroad (%)
Geographical mobility - Moved from abroad (%) - White
Geographical mobility - Moved from abroad (%) - Black or African American
Geographical mobility - Moved from abroad (%) - Asian
Geographical mobility - Moved from abroad (%) - Hispanic or Latino
Geographical mobility - Moved from abroad (%) - American Indian and Alaska Native
Geographical mobility - Moved from abroad (%) - Multirace
Geographical mobility - Moved from abroad (%) - Other Race
Place of birth for the foreign-born population - Ireland (%)
Place of birth for the foreign-born population - Denmark (%)
Place of birth for the foreign-born population - Norway (%)
Place of birth for the foreign-born population - Sweden (%)
Place of birth for the foreign-born population - United Kingdom (%)
Place of birth for the foreign-born population - England (%)
Place of birth for the foreign-born population - Scotland (%)
Place of birth for the foreign-born population - Other Northern Europe (%)
Place of birth for the foreign-born population - Austria (%)
Place of birth for the foreign-born population - Belgium (%)
Place of birth for the foreign-born population - France (%)
Place of birth for the foreign-born population - Germany (%)
Place of birth for the foreign-born population - Netherlands (%)
Place of birth for the foreign-born population - Switzerland (%)
Place of birth for the foreign-born population - Other Western Europe (%)
Place of birth for the foreign-born population - Greece (%)
Place of birth for the foreign-born population - Italy (%)
Place of birth for the foreign-born population - Portugal (%)
Place of birth for the foreign-born population - Spain (%)
Place of birth for the foreign-born population - Other Southern Europe (%)
Place of birth for the foreign-born population - Albania (%)
Place of birth for the foreign-born population - Belarus (%)
Place of birth for the foreign-born population - Bosnia and Herzegovina (%)
Place of birth for the foreign-born population - Bulgaria (%)
Place of birth for the foreign-born population - Croatia (%)
Place of birth for the foreign-born population - Czechoslovakia (%)
Place of birth for the foreign-born population - Hungary (%)
Place of birth for the foreign-born population - Latvia (%)
Place of birth for the foreign-born population - Lithuania (%)
Place of birth for the foreign-born population - North Macedonia (Macedonia) (%)
Place of birth for the foreign-born population - Moldova (%)
Place of birth for the foreign-born population - Poland (%)
Place of birth for the foreign-born population - Romania (%)
Place of birth for the foreign-born population - Russia (%)
Place of birth for the foreign-born population - Serbia (%)
Place of birth for the foreign-born population - Ukraine (%)
Place of birth for the foreign-born population - Other Eastern Europe (%)
Place of birth for the foreign-born population - China (%)
Place of birth for the foreign-born population - Hong Kong (%)
Place of birth for the foreign-born population - Taiwan (%)
Place of birth for the foreign-born population - Japan (%)
Place of birth for the foreign-born population - Korea (%)
Place of birth for the foreign-born population - Other Eastern Asia (%)
Place of birth for the foreign-born population - Afghanistan (%)
Place of birth for the foreign-born population - Bangladesh (%)
Place of birth for the foreign-born population - India (%)
Place of birth for the foreign-born population - Iran (%)
Place of birth for the foreign-born population - Kazakhstan (%)
Place of birth for the foreign-born population - Nepal (%)
Place of birth for the foreign-born population - Pakistan (%)
Place of birth for the foreign-born population - Sri Lanka (%)
Place of birth for the foreign-born population - Uzbekistan (%)
Place of birth for the foreign-born population - Other South Central Asia (%)
Place of birth for the foreign-born population - Burma (%)
Place of birth for the foreign-born population - Cambodia (%)
Place of birth for the foreign-born population - Indonesia (%)
Place of birth for the foreign-born population - Laos (%)
Place of birth for the foreign-born population - Malaysia (%)
Place of birth for the foreign-born population - Philippines (%)
Place of birth for the foreign-born population - Singapore (%)
Place of birth for the foreign-born population - Thailand (%)
Place of birth for the foreign-born population - Vietnam (%)
Place of birth for the foreign-born population - Other South Eastern Asia (%)
Place of birth for the foreign-born population - Armenia (%)
Place of birth for the foreign-born population - Iraq (%)
Place of birth for the foreign-born population - Israel (%)
Place of birth for the foreign-born population - Jordan (%)
Place of birth for the foreign-born population - Kuwait (%)
Place of birth for the foreign-born population - Lebanon (%)
Place of birth for the foreign-born population - Saudi Arabia (%)
Place of birth for the foreign-born population - Syria (%)
Place of birth for the foreign-born population - Turkey (%)
Place of birth for the foreign-born population - Yemen (%)
Place of birth for the foreign-born population - Other Western Asia (%)
Place of birth for the foreign-born population - Eritrea (%)
Place of birth for the foreign-born population - Ethiopia (%)
Place of birth for the foreign-born population - Kenya (%)
Place of birth for the foreign-born population - Somalia (%)
Place of birth for the foreign-born population - Uganda (%)
Place of birth for the foreign-born population - Zimbabwe (%)
Place of birth for the foreign-born population - Other Eastern Africa (%)
Place of birth for the foreign-born population - Cameroon (%)
Place of birth for the foreign-born population - Congo (%)
Place of birth for the foreign-born population - Democratic Republic of Congo (Zaire) (%)
Place of birth for the foreign-born population - Other Middle Africa (%)
Place of birth for the foreign-born population - Egypt (%)
Place of birth for the foreign-born population - Morocco (%)
Place of birth for the foreign-born population - Sudan (%)
Place of birth for the foreign-born population - Other Northern Africa (%)
Place of birth for the foreign-born population - South Africa (%)
Place of birth for the foreign-born population - Other Southern Africa (%)
Place of birth for the foreign-born population - Cabo Verde (%)
Place of birth for the foreign-born population - Ghana (%)
Place of birth for the foreign-born population - Liberia (%)
Place of birth for the foreign-born population - Nigeria (%)
Place of birth for the foreign-born population - Senegal (%)
Place of birth for the foreign-born population - Sierra Leone (%)
Place of birth for the foreign-born population - Other Western Africa (%)
Place of birth for the foreign-born population - Australia (%)
Place of birth for the foreign-born population - New Zealand (%)
Place of birth for the foreign-born population - Fiji (%)
Place of birth for the foreign-born population - Micronesia (%)
Place of birth for the foreign-born population - Bahamas (%)
Place of birth for the foreign-born population - Barbados (%)
Place of birth for the foreign-born population - Cuba (%)
Place of birth for the foreign-born population - Dominica (%)
Place of birth for the foreign-born population - Dominican Republic (%)
Place of birth for the foreign-born population - Grenada (%)
Place of birth for the foreign-born population - Haiti (%)
Place of birth for the foreign-born population - Jamaica (%)
Place of birth for the foreign-born population - St. Vincent and the Grenadines (%)
Place of birth for the foreign-born population - Trinidad and Tobago (%)
Place of birth for the foreign-born population - West Indies (%)
Place of birth for the foreign-born population - Other Caribbean (%)
Place of birth for the foreign-born population - Belize (%)
Place of birth for the foreign-born population - Costa Rica (%)
Place of birth for the foreign-born population - El Salvador (%)
Place of birth for the foreign-born population - Guatemala (%)
Place of birth for the foreign-born population - Honduras (%)
Place of birth for the foreign-born population - Mexico (%)
Place of birth for the foreign-born population - Nicaragua (%)
Place of birth for the foreign-born population - Panama (%)
Place of birth for the foreign-born population - Other Central America (%)
Place of birth for the foreign-born population - Argentina (%)
Place of birth for the foreign-born population - Bolivia (%)
Place of birth for the foreign-born population - Brazil (%)
Place of birth for the foreign-born population - Chile (%)
Place of birth for the foreign-born population - Colombia (%)
Place of birth for the foreign-born population - Ecuador (%)
Place of birth for the foreign-born population - Guyana (%)
Place of birth for the foreign-born population - Peru (%)
Place of birth for the foreign-born population - Uruguay (%)
Place of birth for the foreign-born population - Venezuela (%)
Place of birth for the foreign-born population - Other South America (%)
Place of birth for the foreign-born population - Canada (%)
Place of birth for the foreign-born population - Other Northern America (%)
Place of birth for the foreign-born population - Other (%)
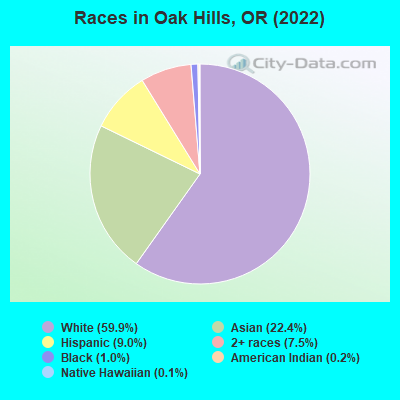
According to 2022 data, the most numerous races in Oak Hills, OR are White alone (7,069 residents), Hispanic (1,061 residents), and Two or more races (889 residents). 68.4% of Oak Hills residents speak English at home. 22.6% of Oak Hills, OR residents are foreign-born (16.4% born in Asia, 3.2% born in Europe), which is 60.1% greater than the foreign-born rate of 9.0% across the entire state of Oregon.
Race distribution in Oak Hills
2000 2022
2,857,616 83.5% White alone 275,314 8.0% Hispanic 100,333 2.9% Asian alone 82,733 2.4% Two or more races 53,325 1.6% Black alone 40,130 1.2% American Indian alone 7,398 0.2% Native Hawaiian and Other 4,550 0.1% Other race alone
3,037,571 71.6% White alone 609,538 14.4% Hispanic 252,744 6.0% Two or more races 191,283 4.5% Asian alone 78,228 1.8% Black alone 29,399 0.7% American Indian alone 25,731 0.6% Other race alone 15,643 0.4% Native Hawaiian and Other
Income and house value in Oak Hills Median household income in 2022 $114,156 White non-Hispanic householders$54,238 Black householders$182,197 Asian householders$146,125 Two or more races householders$69,470 Hispanic or Latino race householdersMedian 2022 house value $720,297 White Non-Hispanic householders$638,260 Black or African American householders$553,158 American Indian or Alaska Native householders $703,617 Asian householders$765,912 Native Hawaiian and other Pacific Islander householders$638,260 Some other race householders$577,327 Two or more races householders$651,535 Hispanic or Latino householders
Median age by race in Oak Hills
39.2 Median age for White residents41.2 37.2 38.6 Median age for Black or African American residents40.3 35.3 62.7 Median age for American Indian / Alaska Native residents-838,647,342.2 -658,119,657.5 38.5 Median age for Asian residents38.6 37.8 -642,169,728.1 Median age for Native Hawaiian / Pacific Islander residents-476,923,076.4 -850,649,349.8 12.3 Median age for Other race residents12.1 26.6 20.5 Median age for Two or more races residents30.2 13.9 40.6 Median age for White alone residents41.1 39.1 18.1 Median age for Hispanic or Latino residents18.8 14.7
Owner/renter occupied households by race in Oak Hills
House owners and renters - White residents 1,894 65.7% Owner occupied987 34.3% Renter occupiedHouse owners and renters - Black or African American residents 48 100.0% Renter occupiedHouse owners and renters - American Indian / Alaska Native residents 14 69.7% Owner occupied6 30.3% Renter occupiedHouse owners and renters - Asian residents 530 65.4% Owner occupied281 34.6% Renter occupiedHouse owners and renters - Native Hawaiian / Pacific Islander residents 7 100.0% Renter occupiedHouse owners and renters - Other race residents 49 100.0% Renter occupiedHouse owners and renters - Two or more races residents 225 63.8% Owner occupied128 36.2% Renter occupiedHouse owners and renters - White alone residents 1,908 67.2% Owner occupied932 32.8% Renter occupiedHouse owners and renters - Hispanic or Latino residents 84 28.5% Owner occupied212 71.5% Renter occupied
Language usage in Oak Hills
English speakers - Total 68.4% of residents of Oak Hills speak English at home.
4.6% of residents speak Spanish at home 366 71.6% Speak English very well145 28.4% Speak English less than very well27.1% of residents speak other language at home 2,114 70.8% Speak English very well870 29.2% Speak English less than very well
English speakers - Born in the United States 83.4% of residents of Oak Hills speak English at home.
6.3% of residents speak Spanish at home 241 86.4% Speak English very well38 13.6% Speak English less than very well10.7% of residents speak other language at home 441 92.3% Speak English very well37 7.7% Speak English less than very well
English speakers - Native, born elsewhere 59.6% of residents of Oak Hills speak English at home.
64.1% of residents speak other language at home 100 100.0% Speak English very well
English speakers - Foreign-born 10.8% of residents of Oak Hills speak English at home.
5.7% of residents speak Spanish at home 43 28.5% Speak English very well108 71.5% Speak English less than very well80.1% of residents speak other language at home 1,316 61.8% Speak English very well812 38.2% Speak English less than very well
White (Caucasian) - Speak only English Native:
95.2% (5,901)Foreign-born:
28.4% (163)
White (Caucasian) - Speak another language Native:
4.8% (297)Foreign-born:
71.8% (413)
Black or African American - Speak only English Native:
82.6% (91)Foreign-born:
14.2% (3)
Black or African American - Speak another language Native:
17.5% (19)Foreign-born:
87.9% (18)
Asian - Speak only English Native:
47.2% (407)Foreign-born:
4.6% (75)
Asian - Speak another language Native:
53.5% (461)Foreign-born:
97.0% (1,584)
Other race - Speak only English Native:
4.6% (10)Foreign-born:
1.3% (1)
Other race - Speak another language Native:
97.5% (207)Foreign-born:
99.4% (96)
Two or more races - Speak only English Native:
85.5% (765)Foreign-born:
22.4% (36)
Two or more races - Speak another language Native:
13.8% (123)Foreign-born:
77.2% (124)
White alone - Speak only English Native:
94.6% (5,704)Foreign-born:
21.9% (132)
White alone - Speak another language Native:
5.8% (349)Foreign-born:
77.9% (470)
Hispanic or Latino - Speak only English Native:
64.1% (438)Foreign-born:
31.9% (81)
Hispanic or Latino - Speak another language Native:
33.3% (227)Foreign-born:
63.4% (162)
Foreign-born residents in Oak Hills 2,661 residents are foreign born (16.4% Asia , 3.2% Europe ).
This city:
22.6%Oregon:
9.8%
Marital status for residents in Oak Hills Marital status - White (Caucasian) population 15 years and over
Males 24.6% Never married63.3% Now married0.2% Separated3.5% Widowed8.5% DivorcedFemales 23.3% Never married56.3% Now married1.6% Separated7.7% Widowed11.1% DivorcedWomen who gave birth in the past 12 months Now married:
100.0% (63)Unmarried:
0.0% (0)
Women who did not give birth in the past 12 months Now married:
53.0% (851)Unmarried:
47.0% (756)
Marital status - Black or African American population 15 years and over
Males 78.7% Never married0.0% Now married4.9% Separated0.0% Widowed16.4% DivorcedFemales 46.8% Never married34.0% Now married0.0% Separated0.0% Widowed19.1% DivorcedWomen who did not give birth in the past 12 months Now married:
42.1% (17)Unmarried:
57.9% (23)
Marital status - American Indian / Alaska Native population 15 years and over
Males 57.1% Never married0.0% Now married0.0% Separated0.0% Widowed42.9% DivorcedFemales 0.0% Never married100.0% Now married0.0% Separated0.0% Widowed0.0% DivorcedMarital status - Asian population 15 years and over
Males 31.5% Never married64.3% Now married0.0% Separated0.0% Widowed4.2% DivorcedFemales 23.9% Never married68.0% Now married0.0% Separated4.7% Widowed3.4% DivorcedWomen who gave birth in the past 12 months Now married:
100.0% (67)Unmarried:
0.0% (0)
Women who did not give birth in the past 12 months Now married:
64.0% (415)Unmarried:
36.0% (233)
Marital status - Other race population 15 years and over
Males 79.5% Never married20.5% Now married0.0% Separated0.0% Widowed0.0% DivorcedFemales 100.0% Never married0.0% Now married0.0% Separated0.0% Widowed0.0% DivorcedWomen who did not give birth in the past 12 months Now married:
0.0% (0)Unmarried:
100.0% (78)
Marital status - Two or more races population 15 years and over
Males 54.4% Never married38.8% Now married0.0% Separated0.0% Widowed6.8% DivorcedFemales 24.6% Never married55.7% Now married0.0% Separated0.8% Widowed18.9% DivorcedWomen who did not give birth in the past 12 months Now married:
49.7% (108)Unmarried:
50.3% (109)
Marital status - White alone, not Hispanic / Latino population 15 years and over
Males 22.9% Never married65.0% Now married0.0% Separated3.3% Widowed8.9% DivorcedFemales 22.5% Never married57.9% Now married0.0% Separated8.1% Widowed11.6% DivorcedWomen who gave birth in the past 12 months Now married:
100.0% (57)Unmarried:
0.0% (0)
Women who did not give birth in the past 12 months Now married:
52.8% (838)Unmarried:
47.2% (749)
Marital status - Hispanic or Latino population 15 years and over
Males 42.5% Never married41.4% Now married1.8% Separated4.4% Widowed9.9% DivorcedFemales 45.2% Never married25.7% Now married18.4% Separated0.8% Widowed10.0% DivorcedWomen who gave birth in the past 12 months Now married:
100.0% (10)Unmarried:
0.0% (0)
Women who did not give birth in the past 12 months Now married:
47.1% (109)Unmarried:
52.9% (122)
Ancestries in Oak Hills
453 7.8% German395 6.8% English302 5.2% American216 3.7% Irish185 3.2% European179 3.1% Polish116 2.0% Italian109 1.9% Iraqi79 1.4% Dutch74 1.3% Norwegian74 1.3% Romanian58 1.0% Scottish42 0.7% African39 0.7% Iranian35 0.6% Swedish30 0.5% British29 0.5% Belgian25 0.4% French Canadian22 0.4% Danish19 0.3% Serbian16 0.3% Swiss12 0.2% French12 0.2% Jamaican11 0.2% Croatian8 0.1% Ukrainian7 0.1% Hungarian7 0.1% Scandinavian7 0.1% Welsh5 0.09% Czech5 0.09% Eastern European3 0.05% Bahamian2 0.03% Scotch-Irish
Children Nativity (place of birth) in Oak Hills
Children under 6 years - Living with two parents Both parents native 568 100.0% NativeBoth parents foreign-born 164 95.5% Native8 4.5% Foreign-bornOne native, one foreign-born parent 73 100.0% NativeChildren under 6 years - Living with one parent Native parent 80 100.0% NativeForeign-born parent 6 100.0% NativeChildren 6 to 17 years - Living with two parents Both parents native 751 99.5% Native3 0.5% Foreign-bornBoth parents foreign-born 628 80.6% Native151 19.4% Foreign-bornOne native, one foreign-born parent 114 100.0% NativeChildren 6 to 17 years - Living with one parent Native parent 470 100.0% NativeForeign-born parent 326 51.3% Native309 48.7% Foreign-born