Races in Pembroke, Massachusetts (MA) Detailed Stats
Ancestries, Foreign-born residents, place of birth

Recent posts about races in Pembroke, Massachusetts on our local forum with over 2,400,000 registered users:
 | Nicer house in Pembroke or hold out for Norwell scituate duxbury? (72 replies) |
| 2024 Real Estate Observations (909 replies) |
| Trying to figure out this house situation (59 replies) |
| What's wrong with this large house? (63 replies) |
| Mass migration: People continue to leave the state (143 replies) |
| towns that offer the most jobs per dollar of house (58 replies) |
Latest news about races in Pembroke, MA collected exclusively by city-data.com from local newspapers, TV, and radio stations
2.0% of Pembroke, MA residents are foreign-born (1.1% born in Europe, 0.6% born in Asia), which is 796.1% less than the foreign-born rate of 18.0% across the entire state of Massachusetts.
Race distribution in Pembroke

- 16,51497.6%White alone
- 1190.7%Two or more races
- 900.5%Hispanic
- 850.5%Asian alone
- 820.5%Black alone
- 260.2%Other race alone
- 90.05%American Indian alone
- 20.01%Native Hawaiian and Other
Pacific Islander alone

2000
2022
-
- 5,198,35981.9%White alone
- 428,7296.8%Hispanic
- 318,3295.0%Black alone
- 236,7863.7%Asian alone
- 110,3381.7%Two or more races
- 43,5860.7%Other race alone
- 11,2640.2%American Indian alone
- 1,7060.03%Native Hawaiian and Other
Pacific Islander alone

-
- 4,676,62767.0%White alone
- 911,03813.0%Hispanic
- 501,4637.2%Asian alone
- 459,7406.6%Black alone
- 341,8894.9%Two or more races
- 84,4031.2%Other race alone
- 5,8380.08%American Indian alone
- 9760.01%Native Hawaiian and Other
Pacific Islander alone

Income and house value in Pembroke
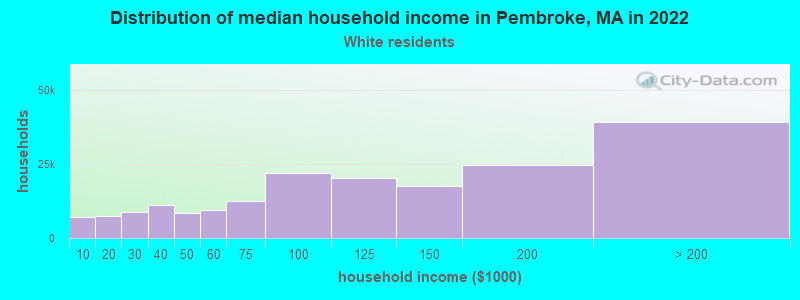
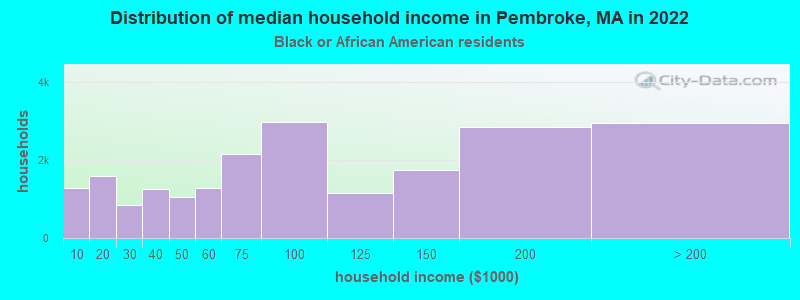
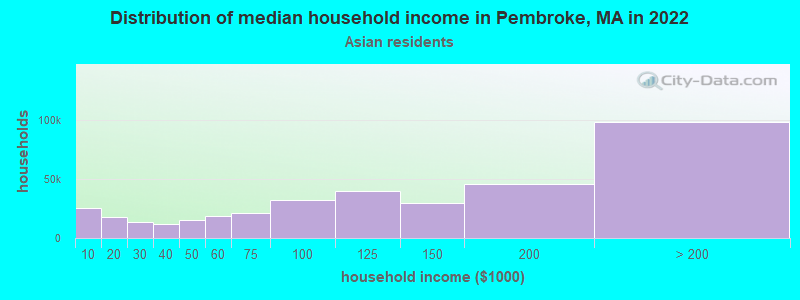
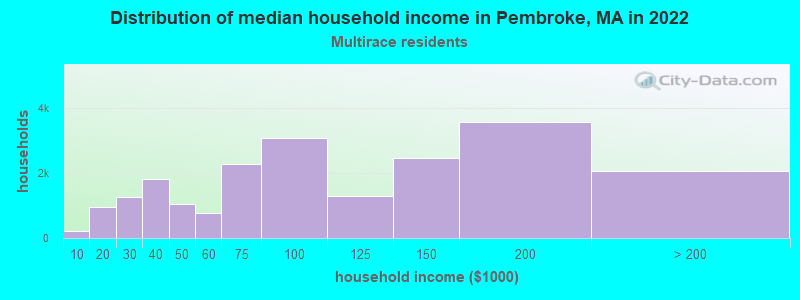
- Median household income in 2022
- $121,219White non-Hispanic householders
- $119,208Black householders
- $170,962Asian householders
- $100,747Some other race householders
- $134,857Two or more races householders
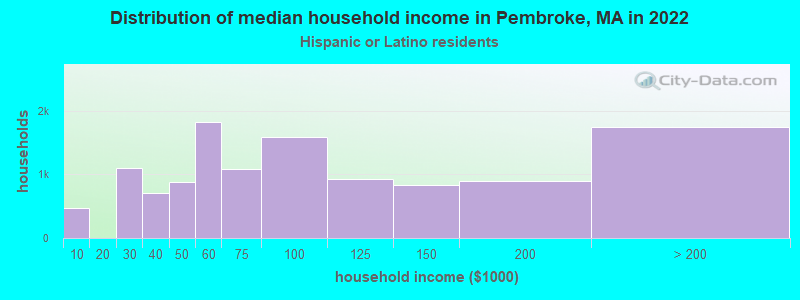
- $130,455Hispanic or Latino race householders
- Median 2022 house value
- $594,196White Non-Hispanic householders
- $373,085Black or African American householders
- $583,919Asian householders
- $455,924Some other race householders
- $615,061Two or more races householders
- $343,811Hispanic or Latino householders
Household income for White non-Hispanic householders
Household income for Black householders
Household income for Asian householders
Household income for Two or more races householders
Household income for Hispanic or Latino race householders
Foreign-born residents in Pembroke
340 residents are foreign born (1.1% Europe, 0.6% Asia).
| This city: | 2.0% |
| Massachusetts: | 12.2% |
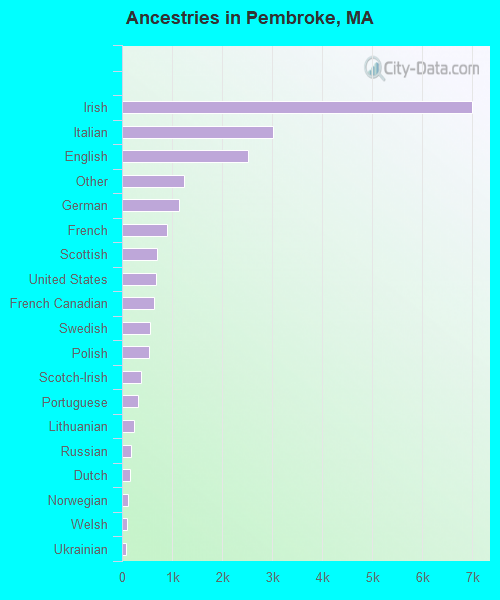
Ancestries in Pembroke

- 6,98633.6%Irish
- 3,02014.5%Italian
- 2,52212.1%English
- 1,2305.9%Other
- 1,1465.5%German
- 8974.3%French
- 7033.4%Scottish
- 6783.3%United States
- 6433.1%French Canadian
- 5692.7%Swedish
- 5372.6%Polish
- 3871.9%Scotch-Irish
- 3151.5%Portuguese
- 2311.1%Lithuanian
- 1840.9%Russian
- 1530.7%Dutch
- 1220.6%Norwegian
- 990.5%Welsh
- 740.4%Ukrainian
- 610.3%Greek
- 580.3%Subsaharan African
- 460.2%Arab
- 320.2%Danish
- 300.1%Swiss
- 290.1%Slovak
- 200.10%Czech
- 120.06%Hungarian
- 110.05%West Indian
Zip codes: 02359.