Races in Portland, Oregon (OR) Detailed Stats
Data:
Races - White alone (%)
Races - White alone (% change since 2000)
Races - Black alone (%)
Races - Black alone (% change since 2000)
Races - American Indian alone (%)
Races - American Indian alone (% change since 2000)
Races - Asian alone (%)
Races - Asian alone (% change since 2000)
Races - Hispanic (%)
Races - Hispanic (% change since 2000)
Races - Native Hawaiian and Other Pacific Islander alone (%)
Races - Native Hawaiian and Other Pacific Islander alone (% change since 2000)
Races - Two or more races(%)
Races - Two or more races(% change since 2000)
Races - Other race alone (%)
Races - Other race alone (% change since 2000)
Racial diversity
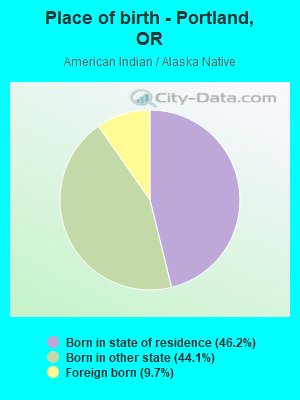
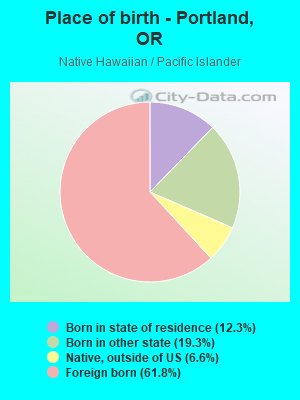
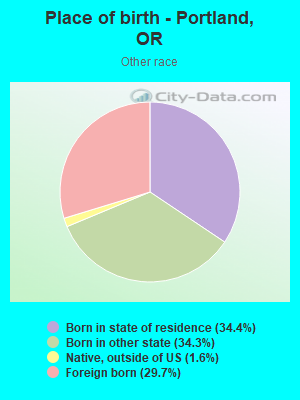
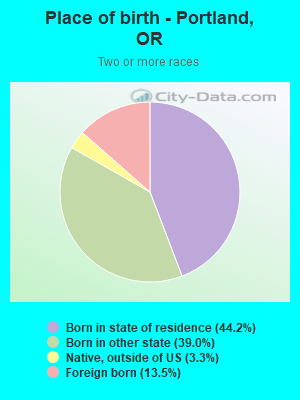
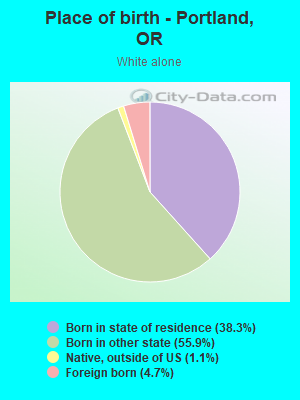
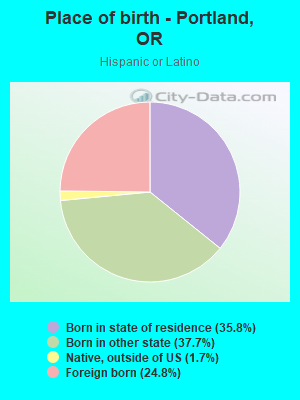
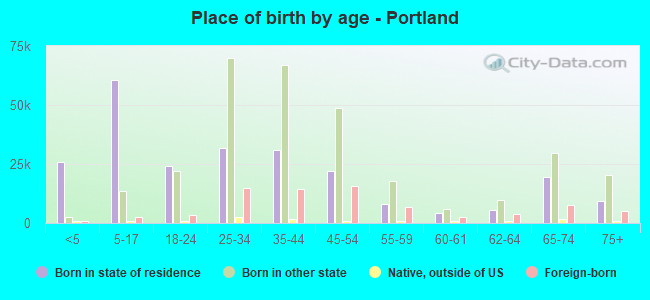
Place of birth - Born in state of residence (%)
Place of birth - Born in state of residence (%) - White
Place of birth - Born in state of residence (%) - Black or African American
Place of birth - Born in state of residence (%) - Asian
Place of birth - Born in state of residence (%) - Hispanic or Latino
Place of birth - Born in state of residence (%) - American Indian and Alaska Native
Place of birth - Born in state of residence (%) - Multirace
Place of birth - Born in state of residence (%) - Other Race
Place of birth - Born in other state (%)
Place of birth - Born in other state (%) - White
Place of birth - Born in other state (%) - Black or African American
Place of birth - Born in other state (%) - Asian
Place of birth - Born in other state (%) - Hispanic or Latino
Place of birth - Born in other state (%) - American Indian and Alaska Native
Place of birth - Born in other state (%) - Multirace
Place of birth - Born in other state (%) - Other Race
Place of birth - Native, outside of US (%)
Place of birth - Native, outside of US (%) - White
Place of birth - Native, outside of US (%) - Black or African American
Place of birth - Native, outside of US (%) - Asian
Place of birth - Native, outside of US (%) - Hispanic or Latino
Place of birth - Native, outside of US (%) - American Indian and Alaska Native
Place of birth - Native, outside of US (%) - Multirace
Place of birth - Native, outside of US (%) - Other Race
Place of birth - Foreign born (%)
Place of birth - Foreign born (%) - White
Place of birth - Foreign born (%) - Black or African American
Place of birth - Foreign born (%) - Asian
Place of birth - Foreign born (%) - Hispanic or Latino
Place of birth - Foreign born (%) - American Indian and Alaska Native
Place of birth - Foreign born (%) - Multirace
Place of birth - Foreign born (%) - Other Race
Residents speaking English at home (%)
Residents speaking English at home - Born in the United States (%)
Residents speaking English at home - Native, born elsewhere (%)
Residents speaking English at home - Foreign born (%)
Residents speaking Spanish at home (%)
Residents speaking Spanish at home - Born in the United States (%)
Residents speaking Spanish at home - Native, born elsewhere (%)
Residents speaking Spanish at home - Foreign born (%)
Residents speaking other language at home (%)
Residents speaking other language at home - Born in the United States (%)
Residents speaking other language at home - Native, born elsewhere (%)
Residents speaking other language at home - Foreign born (%)
Marital status - Never married (%)
Marital status - Now married (%)
Marital status - Separated (%)
Marital status - Widowed (%)
Marital status - Divorced (%)
Ancestries Reported - Arab (%)
Ancestries Reported - Czech (%)
Ancestries Reported - Danish (%)
Ancestries Reported - Dutch (%)
Ancestries Reported - English (%)
Ancestries Reported - French (%)
Ancestries Reported - French Canadian (%)
Ancestries Reported - German (%)
Ancestries Reported - Greek (%)
Ancestries Reported - Hungarian (%)
Ancestries Reported - Irish (%)
Ancestries Reported - Italian (%)
Ancestries Reported - Lithuanian (%)
Ancestries Reported - Norwegian (%)
Ancestries Reported - Polish (%)
Ancestries Reported - Portuguese (%)
Ancestries Reported - Russian (%)
Ancestries Reported - Scotch-Irish (%)
Ancestries Reported - Scottish (%)
Ancestries Reported - Slovak (%)
Ancestries Reported - Subsaharan African (%)
Ancestries Reported - Swedish (%)
Ancestries Reported - Swiss (%)
Ancestries Reported - Ukrainian (%)
Ancestries Reported - United States (%)
Ancestries Reported - Welsh (%)
Ancestries Reported - West Indian (%)
Ancestries Reported - Other (%)
Geographical mobility - Same house 1 year ago (%)
Geographical mobility - Same house 1 year ago (%) - White
Geographical mobility - Same house 1 year ago (%) - Black or African American
Geographical mobility - Same house 1 year ago (%) - Asian
Geographical mobility - Same house 1 year ago (%) - Hispanic or Latino
Geographical mobility - Same house 1 year ago (%) - American Indian and Alaska Native
Geographical mobility - Same house 1 year ago (%) - Multirace
Geographical mobility - Same house 1 year ago (%) - Other Race
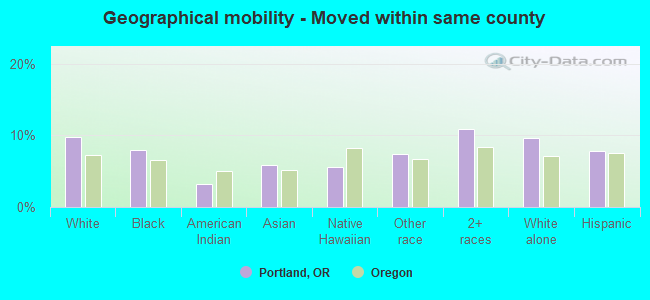
Geographical mobility - Moved within same county (%)
Geographical mobility - Moved within same county (%) - White
Geographical mobility - Moved within same county (%) - Black or African American
Geographical mobility - Moved within same county (%) - Asian
Geographical mobility - Moved within same county (%) - Hispanic or Latino
Geographical mobility - Moved within same county (%) - American Indian and Alaska Native
Geographical mobility - Moved within same county (%) - Multirace
Geographical mobility - Moved within same county (%) - Other Race
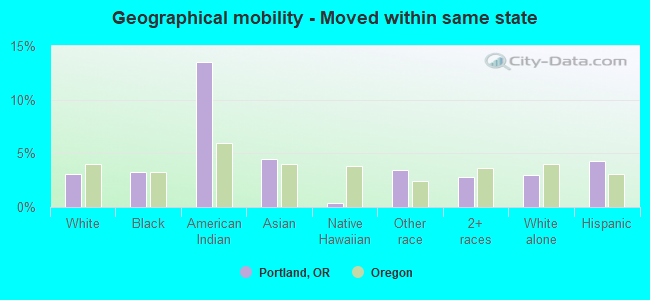
Geographical mobility - Moved from different county within same state (%)
Geographical mobility - Moved from different county within same state (%) - White
Geographical mobility - Moved from different county within same state (%) - Black or African American
Geographical mobility - Moved from different county within same state (%) - Asian
Geographical mobility - Moved from different county within same state (%) - Hispanic or Latino
Geographical mobility - Moved from different county within same state (%) - American Indian and Alaska Native
Geographical mobility - Moved from different county within same state (%) - Multirace
Geographical mobility - Moved from different county within same state (%) - Other Race
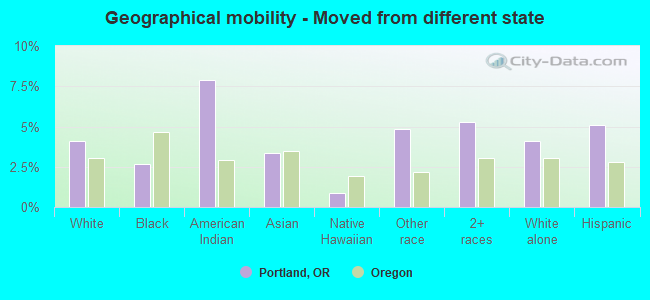
Geographical mobility - Moved from different state (%)
Geographical mobility - Moved from different state (%) - White
Geographical mobility - Moved from different state (%) - Black or African American
Geographical mobility - Moved from different state (%) - Asian
Geographical mobility - Moved from different state (%) - Hispanic or Latino
Geographical mobility - Moved from different state (%) - American Indian and Alaska Native
Geographical mobility - Moved from different state (%) - Multirace
Geographical mobility - Moved from different state (%) - Other Race
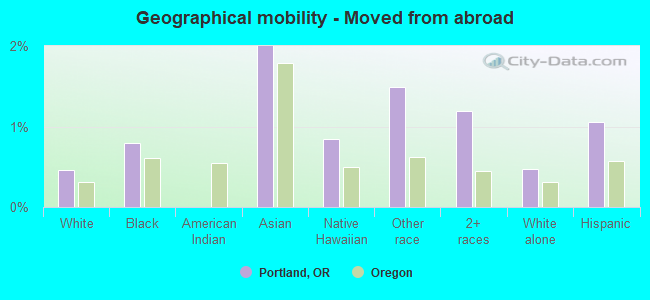
Geographical mobility - Moved from abroad (%)
Geographical mobility - Moved from abroad (%) - White
Geographical mobility - Moved from abroad (%) - Black or African American
Geographical mobility - Moved from abroad (%) - Asian
Geographical mobility - Moved from abroad (%) - Hispanic or Latino
Geographical mobility - Moved from abroad (%) - American Indian and Alaska Native
Geographical mobility - Moved from abroad (%) - Multirace
Geographical mobility - Moved from abroad (%) - Other Race
Place of birth for the foreign-born population - Ireland (%)
Place of birth for the foreign-born population - Denmark (%)
Place of birth for the foreign-born population - Norway (%)
Place of birth for the foreign-born population - Sweden (%)
Place of birth for the foreign-born population - United Kingdom (%)
Place of birth for the foreign-born population - England (%)
Place of birth for the foreign-born population - Scotland (%)
Place of birth for the foreign-born population - Other Northern Europe (%)
Place of birth for the foreign-born population - Austria (%)
Place of birth for the foreign-born population - Belgium (%)
Place of birth for the foreign-born population - France (%)
Place of birth for the foreign-born population - Germany (%)
Place of birth for the foreign-born population - Netherlands (%)
Place of birth for the foreign-born population - Switzerland (%)
Place of birth for the foreign-born population - Other Western Europe (%)
Place of birth for the foreign-born population - Greece (%)
Place of birth for the foreign-born population - Italy (%)
Place of birth for the foreign-born population - Portugal (%)
Place of birth for the foreign-born population - Spain (%)
Place of birth for the foreign-born population - Other Southern Europe (%)
Place of birth for the foreign-born population - Albania (%)
Place of birth for the foreign-born population - Belarus (%)
Place of birth for the foreign-born population - Bosnia and Herzegovina (%)
Place of birth for the foreign-born population - Bulgaria (%)
Place of birth for the foreign-born population - Croatia (%)
Place of birth for the foreign-born population - Czechoslovakia (%)
Place of birth for the foreign-born population - Hungary (%)
Place of birth for the foreign-born population - Latvia (%)
Place of birth for the foreign-born population - Lithuania (%)
Place of birth for the foreign-born population - North Macedonia (Macedonia) (%)
Place of birth for the foreign-born population - Moldova (%)
Place of birth for the foreign-born population - Poland (%)
Place of birth for the foreign-born population - Romania (%)
Place of birth for the foreign-born population - Russia (%)
Place of birth for the foreign-born population - Serbia (%)
Place of birth for the foreign-born population - Ukraine (%)
Place of birth for the foreign-born population - Other Eastern Europe (%)
Place of birth for the foreign-born population - China (%)
Place of birth for the foreign-born population - Hong Kong (%)
Place of birth for the foreign-born population - Taiwan (%)
Place of birth for the foreign-born population - Japan (%)
Place of birth for the foreign-born population - Korea (%)
Place of birth for the foreign-born population - Other Eastern Asia (%)
Place of birth for the foreign-born population - Afghanistan (%)
Place of birth for the foreign-born population - Bangladesh (%)
Place of birth for the foreign-born population - India (%)
Place of birth for the foreign-born population - Iran (%)
Place of birth for the foreign-born population - Kazakhstan (%)
Place of birth for the foreign-born population - Nepal (%)
Place of birth for the foreign-born population - Pakistan (%)
Place of birth for the foreign-born population - Sri Lanka (%)
Place of birth for the foreign-born population - Uzbekistan (%)
Place of birth for the foreign-born population - Other South Central Asia (%)
Place of birth for the foreign-born population - Burma (%)
Place of birth for the foreign-born population - Cambodia (%)
Place of birth for the foreign-born population - Indonesia (%)
Place of birth for the foreign-born population - Laos (%)
Place of birth for the foreign-born population - Malaysia (%)
Place of birth for the foreign-born population - Philippines (%)
Place of birth for the foreign-born population - Singapore (%)
Place of birth for the foreign-born population - Thailand (%)
Place of birth for the foreign-born population - Vietnam (%)
Place of birth for the foreign-born population - Other South Eastern Asia (%)
Place of birth for the foreign-born population - Armenia (%)
Place of birth for the foreign-born population - Iraq (%)
Place of birth for the foreign-born population - Israel (%)
Place of birth for the foreign-born population - Jordan (%)
Place of birth for the foreign-born population - Kuwait (%)
Place of birth for the foreign-born population - Lebanon (%)
Place of birth for the foreign-born population - Saudi Arabia (%)
Place of birth for the foreign-born population - Syria (%)
Place of birth for the foreign-born population - Turkey (%)
Place of birth for the foreign-born population - Yemen (%)
Place of birth for the foreign-born population - Other Western Asia (%)
Place of birth for the foreign-born population - Eritrea (%)
Place of birth for the foreign-born population - Ethiopia (%)
Place of birth for the foreign-born population - Kenya (%)
Place of birth for the foreign-born population - Somalia (%)
Place of birth for the foreign-born population - Uganda (%)
Place of birth for the foreign-born population - Zimbabwe (%)
Place of birth for the foreign-born population - Other Eastern Africa (%)
Place of birth for the foreign-born population - Cameroon (%)
Place of birth for the foreign-born population - Congo (%)
Place of birth for the foreign-born population - Democratic Republic of Congo (Zaire) (%)
Place of birth for the foreign-born population - Other Middle Africa (%)
Place of birth for the foreign-born population - Egypt (%)
Place of birth for the foreign-born population - Morocco (%)
Place of birth for the foreign-born population - Sudan (%)
Place of birth for the foreign-born population - Other Northern Africa (%)
Place of birth for the foreign-born population - South Africa (%)
Place of birth for the foreign-born population - Other Southern Africa (%)
Place of birth for the foreign-born population - Cabo Verde (%)
Place of birth for the foreign-born population - Ghana (%)
Place of birth for the foreign-born population - Liberia (%)
Place of birth for the foreign-born population - Nigeria (%)
Place of birth for the foreign-born population - Senegal (%)
Place of birth for the foreign-born population - Sierra Leone (%)
Place of birth for the foreign-born population - Other Western Africa (%)
Place of birth for the foreign-born population - Australia (%)
Place of birth for the foreign-born population - New Zealand (%)
Place of birth for the foreign-born population - Fiji (%)
Place of birth for the foreign-born population - Micronesia (%)
Place of birth for the foreign-born population - Bahamas (%)
Place of birth for the foreign-born population - Barbados (%)
Place of birth for the foreign-born population - Cuba (%)
Place of birth for the foreign-born population - Dominica (%)
Place of birth for the foreign-born population - Dominican Republic (%)
Place of birth for the foreign-born population - Grenada (%)
Place of birth for the foreign-born population - Haiti (%)
Place of birth for the foreign-born population - Jamaica (%)
Place of birth for the foreign-born population - St. Vincent and the Grenadines (%)
Place of birth for the foreign-born population - Trinidad and Tobago (%)
Place of birth for the foreign-born population - West Indies (%)
Place of birth for the foreign-born population - Other Caribbean (%)
Place of birth for the foreign-born population - Belize (%)
Place of birth for the foreign-born population - Costa Rica (%)
Place of birth for the foreign-born population - El Salvador (%)
Place of birth for the foreign-born population - Guatemala (%)
Place of birth for the foreign-born population - Honduras (%)
Place of birth for the foreign-born population - Mexico (%)
Place of birth for the foreign-born population - Nicaragua (%)
Place of birth for the foreign-born population - Panama (%)
Place of birth for the foreign-born population - Other Central America (%)
Place of birth for the foreign-born population - Argentina (%)
Place of birth for the foreign-born population - Bolivia (%)
Place of birth for the foreign-born population - Brazil (%)
Place of birth for the foreign-born population - Chile (%)
Place of birth for the foreign-born population - Colombia (%)
Place of birth for the foreign-born population - Ecuador (%)
Place of birth for the foreign-born population - Guyana (%)
Place of birth for the foreign-born population - Peru (%)
Place of birth for the foreign-born population - Uruguay (%)
Place of birth for the foreign-born population - Venezuela (%)
Place of birth for the foreign-born population - Other South America (%)
Place of birth for the foreign-born population - Canada (%)
Place of birth for the foreign-born population - Other Northern America (%)
Place of birth for the foreign-born population - Other (%)
Latest news about races in Portland, OR collected exclusively by city-data.com from local newspapers, TV, and radio stations
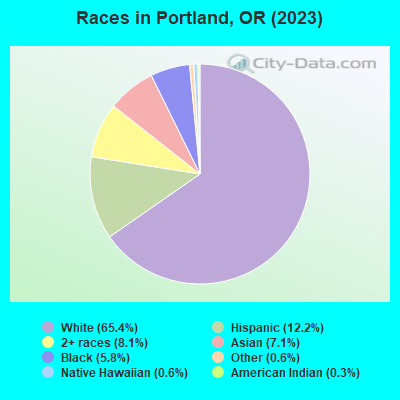
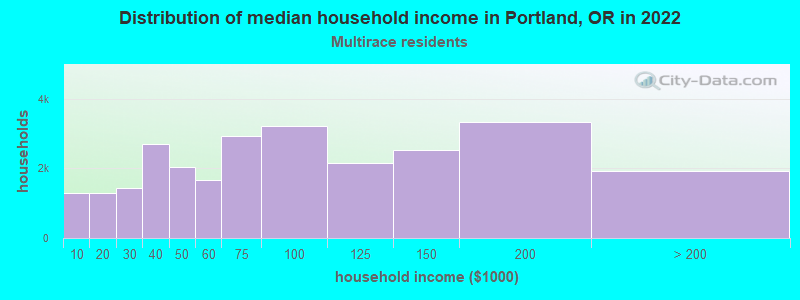
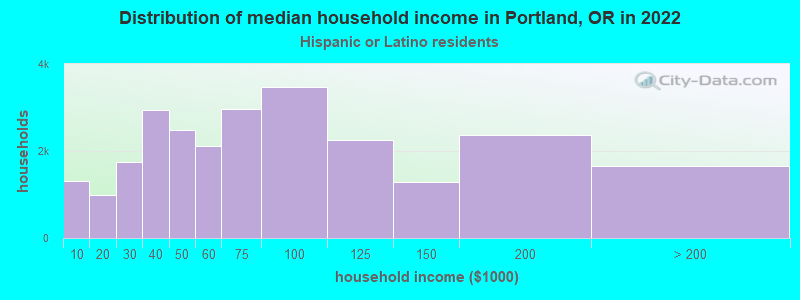
According to 2022 data, the most numerous races in Portland, OR are White alone (418,266 residents), Hispanic (72,015 residents), and Two or more races (45,311 residents). 83.1% of Portland residents speak English at home. 13.1% of Portland, OR residents are foreign-born (5.8% born in Asia, 2.6% born in Latin America, 2.5% born in Europe), which is 31.3% greater than the foreign-born rate of 9.0% across the entire state of Oregon.
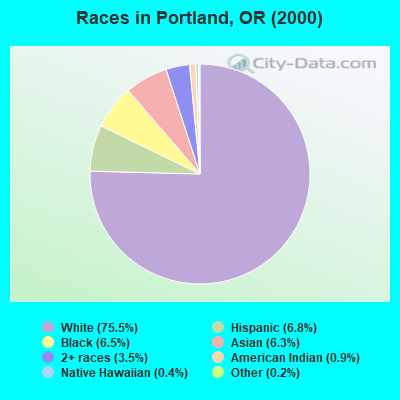
Race distribution in Portland
2000 2022
399,351 75.5% White alone 36,058 6.8% Hispanic 34,395 6.5% Black alone 33,223 6.3% Asian alone 18,401 3.5% Two or more races 4,738 0.9% American Indian alone 1,909 0.4% Native Hawaiian and Other 1,046 0.2% Other race alone
418,266 65.8% White alone 72,015 11.3% Hispanic 52,507 8.3% Asian alone 45,311 7.1% Two or more races 37,552 5.9% Black alone 3,582 0.6% Native Hawaiian and Other 3,101 0.5% American Indian alone 2,962 0.5% Other race alone
2000 2022
2,857,616 83.5% White alone 275,314 8.0% Hispanic 100,333 2.9% Asian alone 82,733 2.4% Two or more races 53,325 1.6% Black alone 40,130 1.2% American Indian alone 7,398 0.2% Native Hawaiian and Other 4,550 0.1% Other race alone
3,037,571 71.6% White alone 609,538 14.4% Hispanic 252,744 6.0% Two or more races 191,283 4.5% Asian alone 78,228 1.8% Black alone 29,399 0.7% American Indian alone 25,731 0.6% Other race alone 15,643 0.4% Native Hawaiian and Other
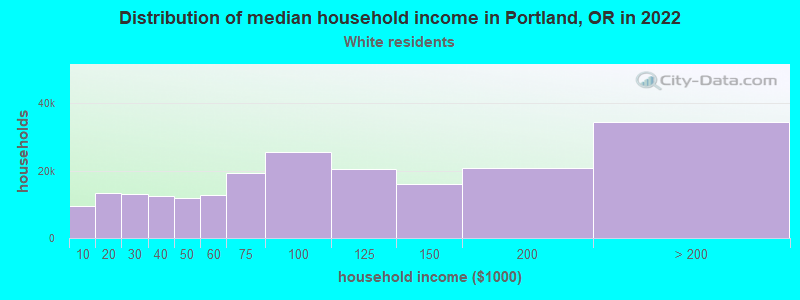
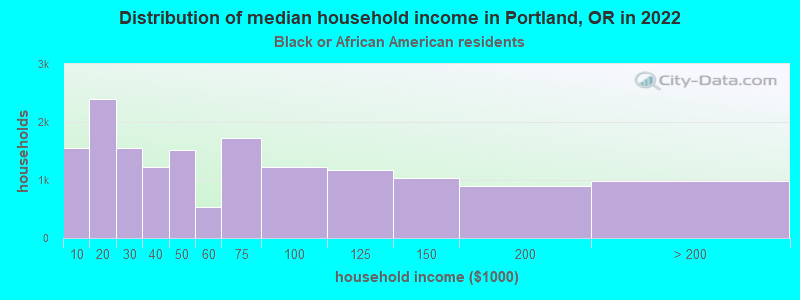
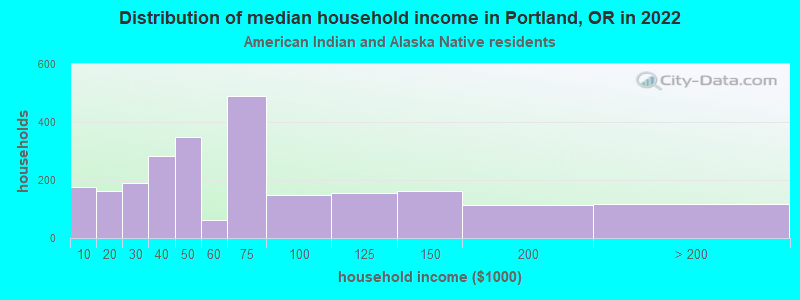
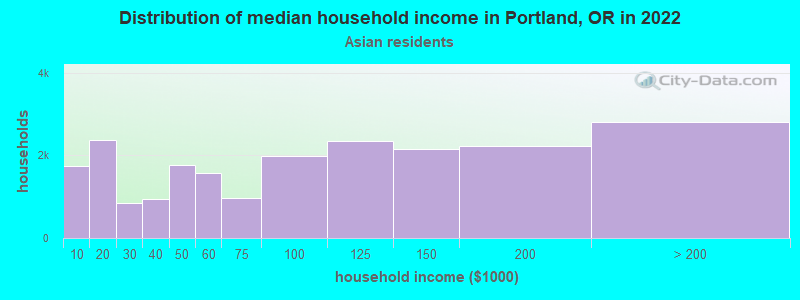
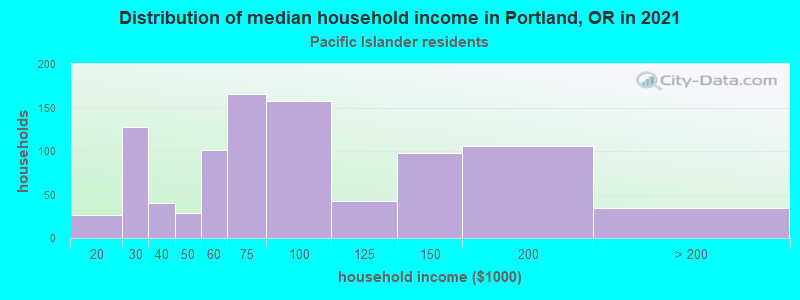
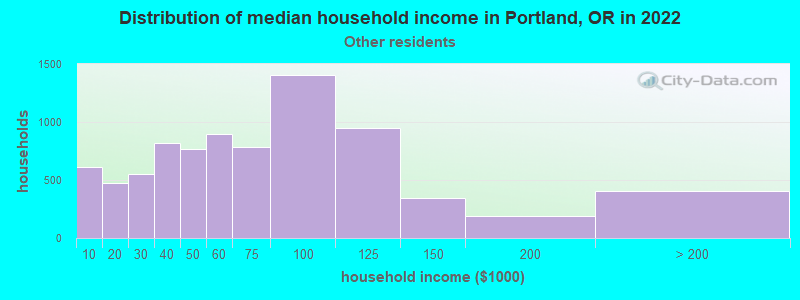
Income and house value in Portland Median household income in 2022 $87,015 White non-Hispanic householders$46,784 Black householders$42,544 American Indian and Alaska Native householders$85,570 Asian householders$33,694 Native Hawaiian and other Pacific Islander householders$59,888 Some other race householders$73,272 Two or more races householders$68,829 Hispanic or Latino race householdersMedian 2022 house value $573,408 White Non-Hispanic householders$509,049 Black or African American householders$504,686 American Indian or Alaska Native householders $525,775 Asian householders$575,226 Native Hawaiian and other Pacific Islander householders$483,233 Some other race householders$517,776 Two or more races householders$494,505 Hispanic or Latino householders
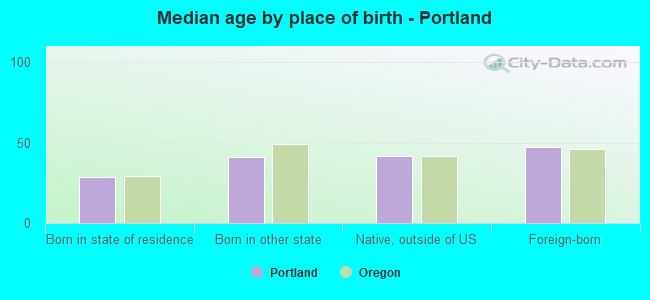
Median age by race in Portland
41.1 Median age for White residents40.8 41.4 33.2 Median age for Black or African American residents33.9 30.9 32.2 Median age for American Indian / Alaska Native residents38.3 22.2 38.9 Median age for Asian residents37.5 40.2 35.1 Median age for Native Hawaiian / Pacific Islander residents35.7 30.8 32.4 Median age for Other race residents33.0 32.4 29.0 Median age for Two or more races residents29.8 28.2 41.5 Median age for White alone residents41.3 41.7 29.7 Median age for Hispanic or Latino residents31.0 28.2
Owner/renter occupied households by race in Portland
House owners and renters - White residents 115,887 55.4% Owner occupied93,296 44.6% Renter occupiedHouse owners and renters - Black or African American residents 3,749 23.7% Owner occupied12,071 76.3% Renter occupiedHouse owners and renters - American Indian / Alaska Native residents 641 34.2% Owner occupied1,236 65.8% Renter occupiedHouse owners and renters - Asian residents 11,696 53.8% Owner occupied10,051 46.2% Renter occupiedHouse owners and renters - Native Hawaiian / Pacific Islander residents 266 23.8% Owner occupied855 76.2% Renter occupiedHouse owners and renters - Other race residents 3,547 43.2% Owner occupied4,663 56.8% Renter occupiedHouse owners and renters - Two or more races residents 9,137 34.5% Owner occupied17,352 65.5% Renter occupiedHouse owners and renters - White alone residents 113,524 55.6% Owner occupied90,613 44.4% Renter occupiedHouse owners and renters - Hispanic or Latino residents 9,455 36.9% Owner occupied16,145 63.1% Renter occupied
Language usage in Portland
English speakers - Total 83.1% of residents of Portland speak English at home.
6.6% of residents speak Spanish at home 27,505 68.8% Speak English very well12,470 31.2% Speak English less than very well10.3% of residents speak other language at home 34,161 54.9% Speak English very well28,099 45.1% Speak English less than very well
English speakers - Born in the United States 94.0% of residents of Portland speak English at home.
3.6% of residents speak Spanish at home 9,488 86.7% Speak English very well1,460 13.3% Speak English less than very well2.4% of residents speak other language at home 6,606 89.0% Speak English very well815 11.0% Speak English less than very well
English speakers - Native, born elsewhere 61.1% of residents of Portland speak English at home.
4.7% of residents speak Spanish at home 374 82.9% Speak English very well77 17.1% Speak English less than very well34.2% of residents speak other language at home 2,250 69.2% Speak English very well1,001 30.8% Speak English less than very well
English speakers - Foreign-born 26.3% of residents of Portland speak English at home.
21.2% of residents speak Spanish at home 6,923 42.6% Speak English very well9,341 57.4% Speak English less than very well52.5% of residents speak other language at home 16,929 42.0% Speak English very well23,350 58.0% Speak English less than very well
White (Caucasian) - Speak only English Native:
95.5% (377,376)Foreign-born:
41.4% (8,778)
White (Caucasian) - Speak another language Native:
4.5% (17,609)Foreign-born:
58.6% (12,410)
Black or African American - Speak only English Native:
97.8% (31,366)Foreign-born:
29.7% (1,487)
Black or African American - Speak another language Native:
2.2% (701)Foreign-born:
70.3% (3,516)
American Indian / Alaska Native - Speak only English Native:
88.1% (5,371)Foreign-born:
16.7% (214)
American Indian / Alaska Native - Speak another language Native:
11.6% (707)Foreign-born:
80.8% (1,032)
Asian - Speak only English Native:
59.0% (12,145)Foreign-born:
22.4% (6,796)
Asian - Speak another language Native:
41.0% (8,438)Foreign-born:
77.6% (23,521)
Native Hawaiian / Pacific Islander - Speak only English Native:
42.5% (435)Foreign-born:
18.8% (417)
Native Hawaiian / Pacific Islander - Speak another language Native:
57.5% (588)Foreign-born:
81.2% (1,798)
Other race - Speak only English Native:
50.6% (7,605)Foreign-born:
12.5% (836)
Other race - Speak another language Native:
49.4% (7,437)Foreign-born:
87.5% (5,860)
Two or more races - Speak only English Native:
82.9% (50,237)Foreign-born:
16.9% (1,815)
Two or more races - Speak another language Native:
17.1% (10,363)Foreign-born:
83.1% (8,900)
White alone - Speak only English Native:
96.5% (370,409)Foreign-born:
43.7% (8,654)
White alone - Speak another language Native:
3.5% (13,330)Foreign-born:
56.3% (11,155)
Hispanic or Latino - Speak only English Native:
59.7% (29,295)Foreign-born:
10.4% (1,857)
Hispanic or Latino - Speak another language Native:
40.3% (19,743)Foreign-born:
89.6% (15,985)
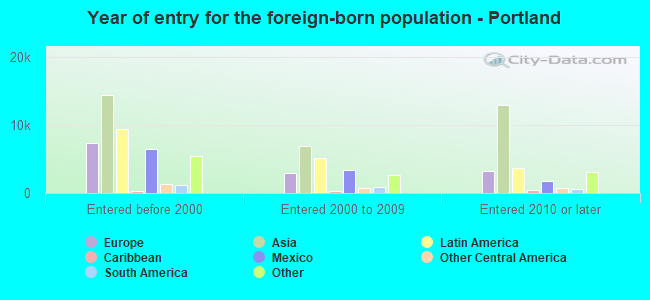
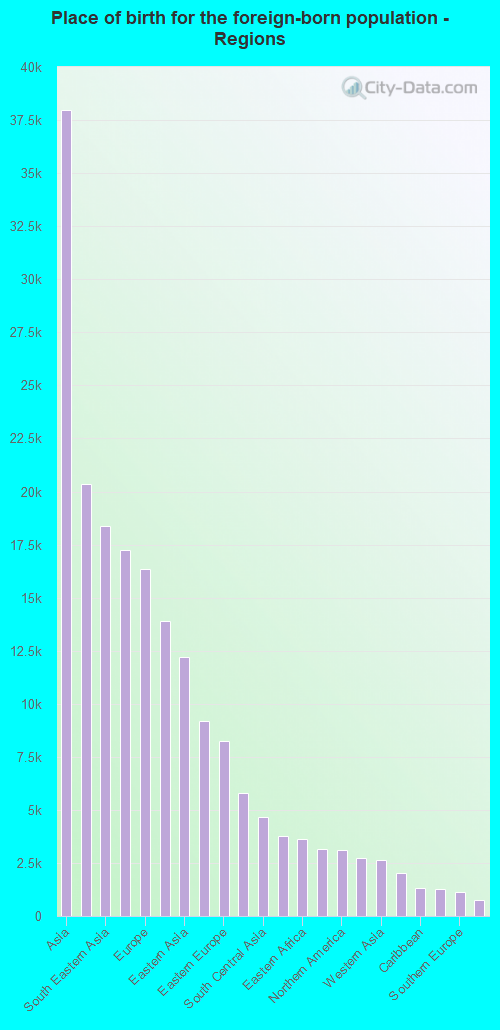
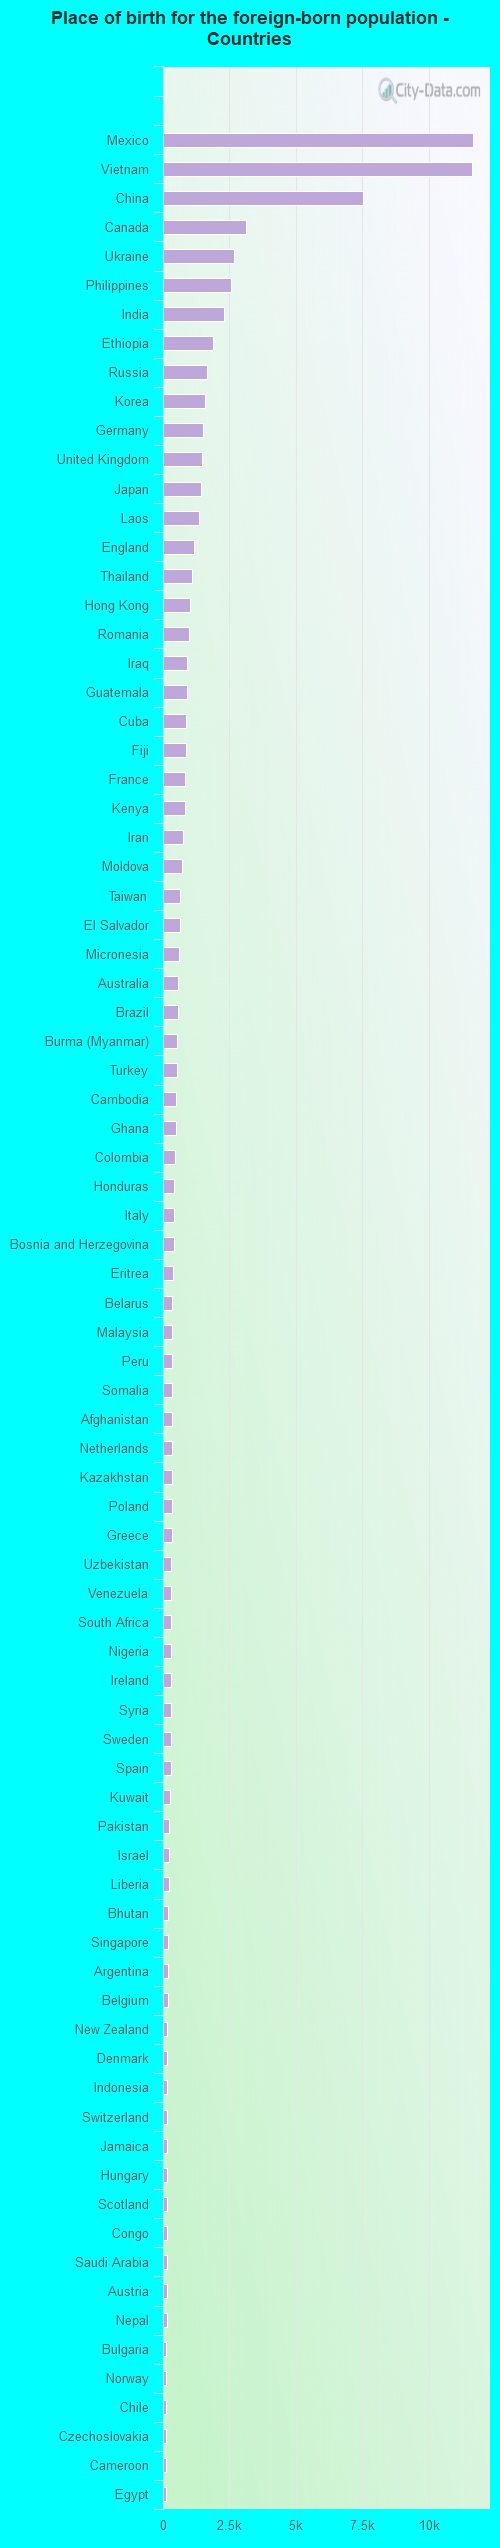
Foreign-born residents in Portland 83,230 residents are foreign born (5.8% Asia , 2.6% Latin America , 2.5% Europe ).
This city:
13.1%Oregon:
9.8%
Marital status for residents in Portland Marital status - White (Caucasian) population 15 years and over
Males 46.5% Never married39.4% Now married1.3% Separated2.0% Widowed10.9% DivorcedFemales 37.3% Never married38.3% Now married1.2% Separated5.3% Widowed17.9% DivorcedWomen who gave birth in the past 12 months Now married:
76.7% (2,727)Unmarried:
23.3% (830)
Women who did not give birth in the past 12 months Now married:
34.6% (39,283)Unmarried:
65.4% (74,264)
Marital status - Black or African American population 15 years and over
Males 55.7% Never married25.5% Now married2.9% Separated1.9% Widowed14.0% DivorcedFemales 60.9% Never married17.3% Now married0.6% Separated2.2% Widowed19.0% DivorcedWomen who gave birth in the past 12 months Now married:
90.5% (408)Unmarried:
9.5% (43)
Women who did not give birth in the past 12 months Now married:
15.5% (1,641)Unmarried:
84.5% (8,917)
Marital status - American Indian / Alaska Native population 15 years and over
Males 32.4% Never married49.3% Now married0.0% Separated0.0% Widowed18.3% DivorcedFemales 64.1% Never married18.2% Now married3.6% Separated4.5% Widowed9.7% DivorcedWomen who gave birth in the past 12 months Now married:
45.1% (35)Unmarried:
54.9% (43)
Women who did not give birth in the past 12 months Now married:
22.6% (419)Unmarried:
77.4% (1,432)
Marital status - Asian population 15 years and over
Males 42.1% Never married49.6% Now married0.5% Separated1.9% Widowed5.9% DivorcedFemales 35.6% Never married50.1% Now married0.2% Separated6.6% Widowed7.5% DivorcedWomen who gave birth in the past 12 months Now married:
95.2% (729)Unmarried:
4.8% (37)
Women who did not give birth in the past 12 months Now married:
41.2% (6,150)Unmarried:
58.8% (8,780)
Marital status - Native Hawaiian / Pacific Islander population 15 years and over
Males 35.7% Never married51.7% Now married4.7% Separated0.6% Widowed7.2% DivorcedFemales 37.4% Never married46.9% Now married0.0% Separated7.1% Widowed8.6% DivorcedWomen who gave birth in the past 12 months Now married:
100.0% (16)Unmarried:
0.0% (0)
Women who did not give birth in the past 12 months Now married:
43.6% (427)Unmarried:
56.4% (554)
Marital status - Other race population 15 years and over
Males 66.0% Never married26.1% Now married0.8% Separated0.0% Widowed7.1% DivorcedFemales 48.0% Never married33.9% Now married3.5% Separated3.2% Widowed11.4% DivorcedWomen who gave birth in the past 12 months Now married:
56.7% (217)Unmarried:
43.3% (166)
Women who did not give birth in the past 12 months Now married:
34.6% (2,250)Unmarried:
65.4% (4,247)
Marital status - Two or more races population 15 years and over
Males 60.2% Never married30.9% Now married0.0% Separated0.5% Widowed8.3% DivorcedFemales 52.4% Never married28.4% Now married2.1% Separated4.4% Widowed12.7% DivorcedWomen who gave birth in the past 12 months Now married:
57.4% (459)Unmarried:
42.6% (340)
Women who did not give birth in the past 12 months Now married:
26.0% (5,666)Unmarried:
74.0% (16,110)
Marital status - White alone, not Hispanic / Latino population 15 years and over
Males 46.0% Never married39.7% Now married1.3% Separated2.0% Widowed11.0% DivorcedFemales 37.0% Never married38.7% Now married1.1% Separated5.3% Widowed17.9% DivorcedWomen who gave birth in the past 12 months Now married:
77.6% (2,687)Unmarried:
22.4% (777)
Women who did not give birth in the past 12 months Now married:
34.9% (38,120)Unmarried:
65.1% (70,990)
Marital status - Hispanic or Latino population 15 years and over
Males 59.8% Never married30.7% Now married0.7% Separated0.3% Widowed8.5% DivorcedFemales 48.9% Never married31.0% Now married1.6% Separated4.5% Widowed14.0% DivorcedWomen who gave birth in the past 12 months Now married:
68.2% (426)Unmarried:
31.8% (199)
Women who did not give birth in the past 12 months Now married:
26.8% (5,671)Unmarried:
73.2% (15,461)
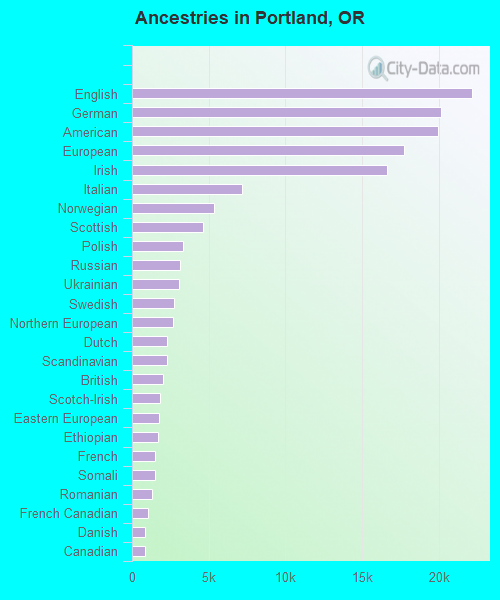
Ancestries in Portland
22,160 7.5% English20,164 6.8% German19,929 6.7% American17,714 6.0% European16,620 5.6% Irish7,182 2.4% Italian5,331 1.8% Norwegian4,614 1.6% Scottish3,294 1.1% Polish3,115 1.0% Russian3,048 1.0% Ukrainian2,730 0.9% Swedish2,694 0.9% Northern European2,277 0.8% Dutch2,262 0.8% Scandinavian2,026 0.7% British1,823 0.6% Scotch-Irish1,744 0.6% Eastern European1,703 0.6% Ethiopian1,519 0.5% French1,514 0.5% Somali1,315 0.4% Romanian1,061 0.4% French Canadian871 0.3% Danish847 0.3% Canadian812 0.3% Greek731 0.2% Turkish726 0.2% African701 0.2% Iranian685 0.2% Finnish672 0.2% Hungarian670 0.2% Nigerian613 0.2% Yugoslavian562 0.2% Swiss505 0.2% Czech457 0.2% Haitian452 0.2% Croatian440 0.1% Welsh437 0.1% Armenian391 0.1% Lithuanian382 0.1% Austrian364 0.1% Trinidadian and Tobagonian341 0.1% Portuguese322 0.1% Lebanese294 0.10% Jamaican293 0.10% Syrian291 0.10% Afghan284 0.10% Ghanaian275 0.09% Liberian271 0.09% Belgian255 0.09% Arab199 0.07% Latvian189 0.06% Jordanian186 0.06% Australian171 0.06% Slavic167 0.06% German Russian149 0.05% Czechoslovakian146 0.05% Kenyan133 0.04% Bulgarian128 0.04% Slovak120 0.04% Celtic119 0.04% Brazilian116 0.04% Israeli115 0.04% Basque112 0.04% Serbian107 0.04% Macedonian95 0.03% Guyanese87 0.03% Palestinian79 0.03% Belizean78 0.03% Iraqi75 0.03% Cajun75 0.03% Senegalese69 0.02% Estonian67 0.02% West Indian64 0.02% Alsatian59 0.02% Slovene44 0.01% Icelander43 0.01% Egyptian41 0.01% Moroccan37 0.01% Ugandan34 0.01% South African27 0.01% Pennsylvania German24 0.01% New Zealander15 0.01% Luxembourger
Geographical mobility in Portland Same house 1 year ago 353,654 82.6% White (Caucasian)32,680 85.4% Black or African American4,744 75.3% American Indian / Alaska Native44,129 84.3% Asian3,378 94.2% Native Hawaiian / Pacific Islander18,481 82.8% Other race62,024 79.8% Two or more races343,276 82.7% White alone, not Hispanic / Latino58,256 81.8% Hispanic or LatinoMoved within same county 41,652 9.7% White / Caucasian3,043 7.9% Black or African American204 3.2% American Indian / Alaska Native3,043 5.8% Asian199 5.5% Native Hawaiian / Pacific Islander1,655 7.4% Other race8,494 10.9% Two or more races40,257 9.7% White alone, not Hispanic / Latino5,550 7.8% Hispanic or LatinoMoved within same state 13,126 3.1% White / Caucasian1,239 3.2% Black or African American852 13.5% American Indian / Alaska Native2,338 4.5% Asian14 0.4% Native Hawaiian / Pacific Islander760 3.4% Other race2,199 2.8% Two or more races12,389 3.0% White alone, not Hispanic / Latino3,073 4.3% Hispanic or LatinoMoved from different state 17,620 4.1% White / Caucasian1,022 2.7% Black or African American498 7.9% American Indian / Alaska Native1,769 3.4% Asian32 0.9% Native Hawaiian / Pacific Islander1,082 4.8% Other race4,099 5.3% Two or more races16,980 4.1% White alone, not Hispanic / Latino3,615 5.1% Hispanic or LatinoMoved from abroad 1,962 0.5% White305 0.8% Black or African American1,055 2.0% Asian30 0.8% Native Hawaiian / Pacific Islander333 1.5% Other race927 1.2% Two or more races1,936 0.5% White alone, not Hispanic / Latino751 1.1% Hispanic or Latino
Children Nativity (place of birth) in Portland
Children under 6 years - Living with two parents Both parents native 17,557 100.0% NativeBoth parents foreign-born 2,893 92.7% Native227 7.3% Foreign-bornOne native, one foreign-born parent 3,109 100.0% NativeChildren under 6 years - Living with one parent Native parent 8,455 100.0% NativeForeign-born parent 1,340 84.1% Native253 15.9% Foreign-bornChildren 6 to 17 years - Living with two parents Both parents native 30,360 99.9% Native39 0.1% Foreign-bornBoth parents foreign-born 5,819 82.6% Native1,223 17.4% Foreign-bornOne native, one foreign-born parent 6,254 94.9% Native333 5.1% Foreign-bornChildren 6 to 17 years - Living with one parent Native parent 18,537 100.0% NativeForeign-born parent 4,138 52.3% Native3,770 47.7% Foreign-born
Place of birth for residents in Portland 37,987 Asia20,376 Americas18,355 South Eastern Asia17,252 Latin America16,330 Europe13,878 Central America12,182 Eastern Asia9,180 China8,246 Eastern Europe5,804 Africa4,685 South Central Asia3,755 Northern Europe3,610 Eastern Africa3,169 Western Europe3,124 Northern America2,731 Oceania2,652 Western Asia2,046 South America1,327 Caribbean1,283 Western Africa1,109 Southern Europe732 Australia and New Zealand Subregion335 Southern Africa272 Middle Africa217 Northern Africa11,683 Mexico11,616 Vietnam7,536 China3,124 Canada2,676 Ukraine2,555 Philippines2,278 India1,886 Ethiopia1,673 Russia1,569 Korea1,500 Germany1,454 United Kingdom1,433 Japan1,351 Laos1,173 England1,082 Thailand1,000 Hong Kong994 Romania903 Iraq893 Guatemala869 Cuba854 Fiji846 France821 Kenya735 Iran720 Moldova642 Taiwan640 El Salvador592 Micronesia563 Australia550 Brazil523 Burma (Myanmar)512 Turkey499 Cambodia487 Ghana451 Colombia419 Honduras402 Italy398 Bosnia and Herzegovina385 Eritrea356 Belarus354 Malaysia349 Peru345 Somalia343 Afghanistan336 Netherlands335 Kazakhstan328 Poland322 Greece319 Uzbekistan312 Venezuela309 South Africa309 Nigeria302 Ireland302 Syria285 Sweden283 Spain249 Kuwait243 Pakistan234 Israel220 Liberia206 Bhutan203 Singapore198 Argentina187 Belgium169 New Zealand168 Denmark167 Indonesia159 Switzerland159 Jamaica152 Hungary151 Scotland142 Congo140 Saudi Arabia139 Austria134 Nepal124 Bulgaria118 Norway118 Chile116 Czechoslovakia112 Cameroon108 Egypt102 Haiti102 Serbia100 Portugal94 Lebanon94 Lithuania77 North Macedonia (Macedonia)76 Senegal74 Trinidad and Tobago69 Morocco68 Belize66 Sierra Leone57 Azerbaijan51 Nicaragua50 United Arab Emirates48 Dominican Republic46 Costa Rica43 Guyana40 Uganda35 Jordan35 Croatia34 Latvia32 Ivory Coast31 Panama30 Marshall Islands28 Barbados25 Tanzania18 Uruguay17 Democratic Republic of Congo (Zaire)15 Dominica14 Bangladesh11 Bahamas11 Sri Lanka9 Azores Islands8 Armenia5 Sudan5 Yemen3 Bolivia
Grandparents responsible for own grandchildren in Portland
Grandparents (30 to 59 years) White / Caucasian 103 19.5% Responsible for grandchildren425 80.5% Not responsible for grandchildrenBlack or African American 8 3.8% Responsible for grandchildren198 96.2% Not responsible for grandchildrenAmerican Indian / Alaska Native 23 100.0% Responsible for grandchildrenAsian 52 16.3% Responsible for grandchildren268 83.7% Not responsible for grandchildrenNative Hawaiian / Pacific Islander 65 48.9% Responsible for grandchildren68 51.1% Not responsible for grandchildrenOther race 73 39.9% Responsible for grandchildren110 60.1% Not responsible for grandchildrenTwo or more races 28 9.0% Responsible for grandchildren281 91.0% Not responsible for grandchildrenWhite alone, not Hispanic / Latino 95 18.7% Responsible for grandchildren412 81.3% Not responsible for grandchildrenHispanic or Latino 102 29.4% Responsible for grandchildren246 70.6% Not responsible for grandchildrenGrandparents (60 years and over) White / Caucasian 212 8.8% Responsible for grandchildren2,207 91.2% Not responsible for grandchildrenBlack or African American 40 20.5% Responsible for grandchildren156 79.5% Not responsible for grandchildrenAmerican Indian / Alaska Native 230 100.0% Responsible for grandchildrenAsian 112 7.0% Responsible for grandchildren1,502 93.0% Not responsible for grandchildrenNative Hawaiian / Pacific Islander 70 100.0% Not responsible for grandchildrenOther race 67 100.0% Not responsible for grandchildrenTwo or more races 187 47.6% Responsible for grandchildren206 52.4% Not responsible for grandchildrenWhite alone, not Hispanic / Latino 206 8.2% Responsible for grandchildren2,297 91.8% Not responsible for grandchildrenHispanic or Latino 41 18.5% Responsible for grandchildren181 81.5% Not responsible for grandchildren
Zip codes: 97201 , 97203 , 97204 , 97205 , 97208, 97209 , 97210 , 97211 , 97212 , 97213 , 97214 , 97215 , 97216 , 97217 , 97218 , 97221 , 97227 , 97232 , 97239 , 97266 .