Races in Somerville, Massachusetts (MA) Detailed Stats
Data:
Races - White alone (%)
Races - White alone (% change since 2000)
Races - Black alone (%)
Races - Black alone (% change since 2000)
Races - American Indian alone (%)
Races - American Indian alone (% change since 2000)
Races - Asian alone (%)
Races - Asian alone (% change since 2000)
Races - Hispanic (%)
Races - Hispanic (% change since 2000)
Races - Native Hawaiian and Other Pacific Islander alone (%)
Races - Native Hawaiian and Other Pacific Islander alone (% change since 2000)
Races - Two or more races(%)
Races - Two or more races(% change since 2000)
Races - Other race alone (%)
Races - Other race alone (% change since 2000)
Racial diversity
Place of birth - Born in state of residence (%)
Place of birth - Born in state of residence (%) - White
Place of birth - Born in state of residence (%) - Black or African American
Place of birth - Born in state of residence (%) - Asian
Place of birth - Born in state of residence (%) - Hispanic or Latino
Place of birth - Born in state of residence (%) - American Indian and Alaska Native
Place of birth - Born in state of residence (%) - Multirace
Place of birth - Born in state of residence (%) - Other Race
Place of birth - Born in other state (%)
Place of birth - Born in other state (%) - White
Place of birth - Born in other state (%) - Black or African American
Place of birth - Born in other state (%) - Asian
Place of birth - Born in other state (%) - Hispanic or Latino
Place of birth - Born in other state (%) - American Indian and Alaska Native
Place of birth - Born in other state (%) - Multirace
Place of birth - Born in other state (%) - Other Race
Place of birth - Native, outside of US (%)
Place of birth - Native, outside of US (%) - White
Place of birth - Native, outside of US (%) - Black or African American
Place of birth - Native, outside of US (%) - Asian
Place of birth - Native, outside of US (%) - Hispanic or Latino
Place of birth - Native, outside of US (%) - American Indian and Alaska Native
Place of birth - Native, outside of US (%) - Multirace
Place of birth - Native, outside of US (%) - Other Race
Place of birth - Foreign born (%)
Place of birth - Foreign born (%) - White
Place of birth - Foreign born (%) - Black or African American
Place of birth - Foreign born (%) - Asian
Place of birth - Foreign born (%) - Hispanic or Latino
Place of birth - Foreign born (%) - American Indian and Alaska Native
Place of birth - Foreign born (%) - Multirace
Place of birth - Foreign born (%) - Other Race
Residents speaking English at home (%)
Residents speaking English at home - Born in the United States (%)
Residents speaking English at home - Native, born elsewhere (%)
Residents speaking English at home - Foreign born (%)
Residents speaking Spanish at home (%)
Residents speaking Spanish at home - Born in the United States (%)
Residents speaking Spanish at home - Native, born elsewhere (%)
Residents speaking Spanish at home - Foreign born (%)
Residents speaking other language at home (%)
Residents speaking other language at home - Born in the United States (%)
Residents speaking other language at home - Native, born elsewhere (%)
Residents speaking other language at home - Foreign born (%)
Marital status - Never married (%)
Marital status - Now married (%)
Marital status - Separated (%)
Marital status - Widowed (%)
Marital status - Divorced (%)
Ancestries Reported - Arab (%)
Ancestries Reported - Czech (%)
Ancestries Reported - Danish (%)
Ancestries Reported - Dutch (%)
Ancestries Reported - English (%)
Ancestries Reported - French (%)
Ancestries Reported - French Canadian (%)
Ancestries Reported - German (%)
Ancestries Reported - Greek (%)
Ancestries Reported - Hungarian (%)
Ancestries Reported - Irish (%)
Ancestries Reported - Italian (%)
Ancestries Reported - Lithuanian (%)
Ancestries Reported - Norwegian (%)
Ancestries Reported - Polish (%)
Ancestries Reported - Portuguese (%)
Ancestries Reported - Russian (%)
Ancestries Reported - Scotch-Irish (%)
Ancestries Reported - Scottish (%)
Ancestries Reported - Slovak (%)
Ancestries Reported - Subsaharan African (%)
Ancestries Reported - Swedish (%)
Ancestries Reported - Swiss (%)
Ancestries Reported - Ukrainian (%)
Ancestries Reported - United States (%)
Ancestries Reported - Welsh (%)
Ancestries Reported - West Indian (%)
Ancestries Reported - Other (%)
Geographical mobility - Same house 1 year ago (%)
Geographical mobility - Same house 1 year ago (%) - White
Geographical mobility - Same house 1 year ago (%) - Black or African American
Geographical mobility - Same house 1 year ago (%) - Asian
Geographical mobility - Same house 1 year ago (%) - Hispanic or Latino
Geographical mobility - Same house 1 year ago (%) - American Indian and Alaska Native
Geographical mobility - Same house 1 year ago (%) - Multirace
Geographical mobility - Same house 1 year ago (%) - Other Race
Geographical mobility - Moved within same county (%)
Geographical mobility - Moved within same county (%) - White
Geographical mobility - Moved within same county (%) - Black or African American
Geographical mobility - Moved within same county (%) - Asian
Geographical mobility - Moved within same county (%) - Hispanic or Latino
Geographical mobility - Moved within same county (%) - American Indian and Alaska Native
Geographical mobility - Moved within same county (%) - Multirace
Geographical mobility - Moved within same county (%) - Other Race
Geographical mobility - Moved from different county within same state (%)
Geographical mobility - Moved from different county within same state (%) - White
Geographical mobility - Moved from different county within same state (%) - Black or African American
Geographical mobility - Moved from different county within same state (%) - Asian
Geographical mobility - Moved from different county within same state (%) - Hispanic or Latino
Geographical mobility - Moved from different county within same state (%) - American Indian and Alaska Native
Geographical mobility - Moved from different county within same state (%) - Multirace
Geographical mobility - Moved from different county within same state (%) - Other Race
Geographical mobility - Moved from different state (%)
Geographical mobility - Moved from different state (%) - White
Geographical mobility - Moved from different state (%) - Black or African American
Geographical mobility - Moved from different state (%) - Asian
Geographical mobility - Moved from different state (%) - Hispanic or Latino
Geographical mobility - Moved from different state (%) - American Indian and Alaska Native
Geographical mobility - Moved from different state (%) - Multirace
Geographical mobility - Moved from different state (%) - Other Race
Geographical mobility - Moved from abroad (%)
Geographical mobility - Moved from abroad (%) - White
Geographical mobility - Moved from abroad (%) - Black or African American
Geographical mobility - Moved from abroad (%) - Asian
Geographical mobility - Moved from abroad (%) - Hispanic or Latino
Geographical mobility - Moved from abroad (%) - American Indian and Alaska Native
Geographical mobility - Moved from abroad (%) - Multirace
Geographical mobility - Moved from abroad (%) - Other Race
Place of birth for the foreign-born population - Ireland (%)
Place of birth for the foreign-born population - Denmark (%)
Place of birth for the foreign-born population - Norway (%)
Place of birth for the foreign-born population - Sweden (%)
Place of birth for the foreign-born population - United Kingdom (%)
Place of birth for the foreign-born population - England (%)
Place of birth for the foreign-born population - Scotland (%)
Place of birth for the foreign-born population - Other Northern Europe (%)
Place of birth for the foreign-born population - Austria (%)
Place of birth for the foreign-born population - Belgium (%)
Place of birth for the foreign-born population - France (%)
Place of birth for the foreign-born population - Germany (%)
Place of birth for the foreign-born population - Netherlands (%)
Place of birth for the foreign-born population - Switzerland (%)
Place of birth for the foreign-born population - Other Western Europe (%)
Place of birth for the foreign-born population - Greece (%)
Place of birth for the foreign-born population - Italy (%)
Place of birth for the foreign-born population - Portugal (%)
Place of birth for the foreign-born population - Spain (%)
Place of birth for the foreign-born population - Other Southern Europe (%)
Place of birth for the foreign-born population - Albania (%)
Place of birth for the foreign-born population - Belarus (%)
Place of birth for the foreign-born population - Bosnia and Herzegovina (%)
Place of birth for the foreign-born population - Bulgaria (%)
Place of birth for the foreign-born population - Croatia (%)
Place of birth for the foreign-born population - Czechoslovakia (%)
Place of birth for the foreign-born population - Hungary (%)
Place of birth for the foreign-born population - Latvia (%)
Place of birth for the foreign-born population - Lithuania (%)
Place of birth for the foreign-born population - North Macedonia (Macedonia) (%)
Place of birth for the foreign-born population - Moldova (%)
Place of birth for the foreign-born population - Poland (%)
Place of birth for the foreign-born population - Romania (%)
Place of birth for the foreign-born population - Russia (%)
Place of birth for the foreign-born population - Serbia (%)
Place of birth for the foreign-born population - Ukraine (%)
Place of birth for the foreign-born population - Other Eastern Europe (%)
Place of birth for the foreign-born population - China (%)
Place of birth for the foreign-born population - Hong Kong (%)
Place of birth for the foreign-born population - Taiwan (%)
Place of birth for the foreign-born population - Japan (%)
Place of birth for the foreign-born population - Korea (%)
Place of birth for the foreign-born population - Other Eastern Asia (%)
Place of birth for the foreign-born population - Afghanistan (%)
Place of birth for the foreign-born population - Bangladesh (%)
Place of birth for the foreign-born population - India (%)
Place of birth for the foreign-born population - Iran (%)
Place of birth for the foreign-born population - Kazakhstan (%)
Place of birth for the foreign-born population - Nepal (%)
Place of birth for the foreign-born population - Pakistan (%)
Place of birth for the foreign-born population - Sri Lanka (%)
Place of birth for the foreign-born population - Uzbekistan (%)
Place of birth for the foreign-born population - Other South Central Asia (%)
Place of birth for the foreign-born population - Burma (%)
Place of birth for the foreign-born population - Cambodia (%)
Place of birth for the foreign-born population - Indonesia (%)
Place of birth for the foreign-born population - Laos (%)
Place of birth for the foreign-born population - Malaysia (%)
Place of birth for the foreign-born population - Philippines (%)
Place of birth for the foreign-born population - Singapore (%)
Place of birth for the foreign-born population - Thailand (%)
Place of birth for the foreign-born population - Vietnam (%)
Place of birth for the foreign-born population - Other South Eastern Asia (%)
Place of birth for the foreign-born population - Armenia (%)
Place of birth for the foreign-born population - Iraq (%)
Place of birth for the foreign-born population - Israel (%)
Place of birth for the foreign-born population - Jordan (%)
Place of birth for the foreign-born population - Kuwait (%)
Place of birth for the foreign-born population - Lebanon (%)
Place of birth for the foreign-born population - Saudi Arabia (%)
Place of birth for the foreign-born population - Syria (%)
Place of birth for the foreign-born population - Turkey (%)
Place of birth for the foreign-born population - Yemen (%)
Place of birth for the foreign-born population - Other Western Asia (%)
Place of birth for the foreign-born population - Eritrea (%)
Place of birth for the foreign-born population - Ethiopia (%)
Place of birth for the foreign-born population - Kenya (%)
Place of birth for the foreign-born population - Somalia (%)
Place of birth for the foreign-born population - Uganda (%)
Place of birth for the foreign-born population - Zimbabwe (%)
Place of birth for the foreign-born population - Other Eastern Africa (%)
Place of birth for the foreign-born population - Cameroon (%)
Place of birth for the foreign-born population - Congo (%)
Place of birth for the foreign-born population - Democratic Republic of Congo (Zaire) (%)
Place of birth for the foreign-born population - Other Middle Africa (%)
Place of birth for the foreign-born population - Egypt (%)
Place of birth for the foreign-born population - Morocco (%)
Place of birth for the foreign-born population - Sudan (%)
Place of birth for the foreign-born population - Other Northern Africa (%)
Place of birth for the foreign-born population - South Africa (%)
Place of birth for the foreign-born population - Other Southern Africa (%)
Place of birth for the foreign-born population - Cabo Verde (%)
Place of birth for the foreign-born population - Ghana (%)
Place of birth for the foreign-born population - Liberia (%)
Place of birth for the foreign-born population - Nigeria (%)
Place of birth for the foreign-born population - Senegal (%)
Place of birth for the foreign-born population - Sierra Leone (%)
Place of birth for the foreign-born population - Other Western Africa (%)
Place of birth for the foreign-born population - Australia (%)
Place of birth for the foreign-born population - New Zealand (%)
Place of birth for the foreign-born population - Fiji (%)
Place of birth for the foreign-born population - Micronesia (%)
Place of birth for the foreign-born population - Bahamas (%)
Place of birth for the foreign-born population - Barbados (%)
Place of birth for the foreign-born population - Cuba (%)
Place of birth for the foreign-born population - Dominica (%)
Place of birth for the foreign-born population - Dominican Republic (%)
Place of birth for the foreign-born population - Grenada (%)
Place of birth for the foreign-born population - Haiti (%)
Place of birth for the foreign-born population - Jamaica (%)
Place of birth for the foreign-born population - St. Vincent and the Grenadines (%)
Place of birth for the foreign-born population - Trinidad and Tobago (%)
Place of birth for the foreign-born population - West Indies (%)
Place of birth for the foreign-born population - Other Caribbean (%)
Place of birth for the foreign-born population - Belize (%)
Place of birth for the foreign-born population - Costa Rica (%)
Place of birth for the foreign-born population - El Salvador (%)
Place of birth for the foreign-born population - Guatemala (%)
Place of birth for the foreign-born population - Honduras (%)
Place of birth for the foreign-born population - Mexico (%)
Place of birth for the foreign-born population - Nicaragua (%)
Place of birth for the foreign-born population - Panama (%)
Place of birth for the foreign-born population - Other Central America (%)
Place of birth for the foreign-born population - Argentina (%)
Place of birth for the foreign-born population - Bolivia (%)
Place of birth for the foreign-born population - Brazil (%)
Place of birth for the foreign-born population - Chile (%)
Place of birth for the foreign-born population - Colombia (%)
Place of birth for the foreign-born population - Ecuador (%)
Place of birth for the foreign-born population - Guyana (%)
Place of birth for the foreign-born population - Peru (%)
Place of birth for the foreign-born population - Uruguay (%)
Place of birth for the foreign-born population - Venezuela (%)
Place of birth for the foreign-born population - Other South America (%)
Place of birth for the foreign-born population - Canada (%)
Place of birth for the foreign-born population - Other Northern America (%)
Place of birth for the foreign-born population - Other (%)
Latest news about races in Somerville, MA collected exclusively by city-data.com from local newspapers, TV, and radio stations
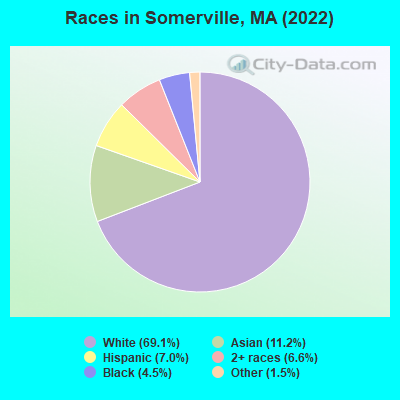
According to 2022 data, the most numerous races in Somerville, MA are White alone (55,133 residents), Hispanic (5,610 residents), and Asian alone (8,924 residents). 75.3% of Somerville residents speak English at home. 24.6% of Somerville, MA residents are foreign-born (8.9% born in Latin America, 7.0% born in Asia, 5.4% born in Europe), which is 26.7% greater than the foreign-born rate of 18.0% across the entire state of Massachusetts.
Race distribution in Somerville
2000 2022
56,320 72.7% White alone 6,786 8.8% Hispanic 4,972 6.4% Asian alone 4,868 6.3% Black alone 3,174 4.1% Two or more races 1,197 1.5% Other race alone 128 0.2% American Indian alone 33 0.04% Native Hawaiian and Other
55,133 69.1% White alone 8,924 11.2% Asian alone 5,610 7.0% Hispanic 5,245 6.6% Two or more races 3,614 4.5% Black alone 1,168 1.5% Other race alone 67 0.08% American Indian alone
2000 2022
5,198,359 81.9% White alone 428,729 6.8% Hispanic 318,329 5.0% Black alone 236,786 3.7% Asian alone 110,338 1.7% Two or more races 43,586 0.7% Other race alone 11,264 0.2% American Indian alone 1,706 0.03% Native Hawaiian and Other
4,676,627 67.0% White alone 911,038 13.0% Hispanic 501,463 7.2% Asian alone 459,740 6.6% Black alone 341,889 4.9% Two or more races 84,403 1.2% Other race alone 5,838 0.08% American Indian alone 976 0.01% Native Hawaiian and Other
Income and house value in Somerville Median household income in 2022 $126,308 White non-Hispanic householders$130,010 Black householders$152,875 Asian householders$62,185 Some other race householders$67,785 Two or more races householders$94,656 Hispanic or Latino race householdersMedian 2022 house value $770,563 White Non-Hispanic householders$908,138 Black or African American householders$898,515 American Indian or Alaska Native householders $721,021 Asian householders$920,612 Some other race householders$579,169 Two or more races householders$762,722 Hispanic or Latino householders
Median age by race in Somerville
31.8 Median age for White residents31.4 32.4 39.4 Median age for Black or African American residents40.2 39.3 -666,666,666.0 Median age for American Indian / Alaska Native residents-666,666,666.0 -666,666,666.0 29.3 Median age for Asian residents31.0 28.9 -666,666,666.0 Median age for Native Hawaiian / Pacific Islander residents-666,666,666.0 -666,666,666.0 45.7 Median age for Other race residents45.7 47.0 27.1 Median age for Two or more races residents26.3 29.3 31.9 Median age for White alone residents31.6 32.3 29.9 Median age for Hispanic or Latino residents26.2 34.5
Owner/renter occupied households by race in Somerville
House owners and renters - White residents 8,934 32.3% Owner occupied18,735 67.7% Renter occupiedHouse owners and renters - Black or African American residents 396 26.6% Owner occupied1,094 73.4% Renter occupiedHouse owners and renters - American Indian / Alaska Native residents 37 39.6% Owner occupied56 60.4% Renter occupiedHouse owners and renters - Asian residents 966 28.6% Owner occupied2,411 71.4% Renter occupiedHouse owners and renters - Native Hawaiian / Pacific Islander residents 14 100.0% Renter occupiedHouse owners and renters - Other race residents 247 40.0% Owner occupied370 60.0% Renter occupiedHouse owners and renters - Two or more races residents 584 21.0% Owner occupied2,197 79.0% Renter occupiedHouse owners and renters - White alone residents 8,625 32.1% Owner occupied18,281 67.9% Renter occupiedHouse owners and renters - Hispanic or Latino residents 550 30.2% Owner occupied1,269 69.8% Renter occupied
Language usage in Somerville
English speakers - Total 75.3% of residents of Somerville speak English at home.
4.9% of residents speak Spanish at home 2,459 65.8% Speak English very well1,279 34.2% Speak English less than very well19.8% of residents speak other language at home 10,706 70.3% Speak English very well4,532 29.7% Speak English less than very well
English speakers - Born in the United States 91.9% of residents of Somerville speak English at home.
2.4% of residents speak Spanish at home 678 93.3% Speak English very well49 6.7% Speak English less than very well5.7% of residents speak other language at home 1,611 94.8% Speak English very well88 5.2% Speak English less than very well
English speakers - Native, born elsewhere 52.2% of residents of Somerville speak English at home.
28.3% of residents speak Spanish at home 344 68.1% Speak English very well161 31.9% Speak English less than very well19.5% of residents speak other language at home 349 100.0% Speak English very well
English speakers - Foreign-born 20.4% of residents of Somerville speak English at home.
11.6% of residents speak Spanish at home 1,002 52.7% Speak English very well900 47.3% Speak English less than very well68.0% of residents speak other language at home 6,842 61.3% Speak English very well4,319 38.7% Speak English less than very well
White (Caucasian) - Speak only English Native:
94.4% (47,283)Foreign-born:
19.3% (1,174)
White (Caucasian) - Speak another language Native:
5.6% (2,806)Foreign-born:
80.7% (4,900)
Black or African American - Speak only English Native:
88.7% (1,885)Foreign-born:
36.5% (544)
Black or African American - Speak another language Native:
11.3% (239)Foreign-born:
63.5% (946)
American Indian / Alaska Native - Speak only English Native:
63.5% (54)Foreign-born:
49.3% (78)
Asian - Speak only English Native:
54.2% (1,549)Foreign-born:
23.9% (1,350)
Asian - Speak another language Native:
45.8% (1,308)Foreign-born:
76.1% (4,306)
Other race - Speak only English Native:
63.6% (316)Foreign-born:
13.9% (158)
Other race - Speak another language Native:
36.4% (181)Foreign-born:
86.1% (981)
Two or more races - Speak only English Native:
70.9% (3,356)Foreign-born:
5.6% (114)
Two or more races - Speak another language Native:
29.1% (1,379)Foreign-born:
94.4% (1,930)
White alone - Speak only English Native:
95.2% (46,356)Foreign-born:
23.6% (1,121)
White alone - Speak another language Native:
4.8% (2,362)Foreign-born:
76.4% (3,624)
Hispanic or Latino - Speak only English Native:
54.6% (1,853)Foreign-born:
5.5% (107)
Hispanic or Latino - Speak another language Native:
45.4% (1,540)Foreign-born:
94.5% (1,827)
Foreign-born residents in Somerville 19,683 residents are foreign born (8.9% Latin America , 7.0% Asia , 5.4% Europe ).
This city:
24.6%Massachusetts:
17.6%
Marital status for residents in Somerville Marital status - White (Caucasian) population 15 years and over
Males 63.9% Never married30.0% Now married0.0% Separated1.1% Widowed5.1% DivorcedFemales 59.9% Never married28.3% Now married0.4% Separated4.3% Widowed7.1% DivorcedWomen who gave birth in the past 12 months Now married:
93.0% (370)Unmarried:
7.0% (28)
Women who did not give birth in the past 12 months Now married:
21.2% (4,111)Unmarried:
78.8% (15,269)
Marital status - Black or African American population 15 years and over
Males 64.7% Never married24.4% Now married0.0% Separated0.2% Widowed10.7% DivorcedFemales 64.3% Never married11.7% Now married7.8% Separated7.6% Widowed8.6% DivorcedWomen who gave birth in the past 12 months Now married:
56.9% (28)Unmarried:
43.1% (21)
Women who did not give birth in the past 12 months Now married:
9.1% (100)Unmarried:
90.9% (999)
Marital status - American Indian / Alaska Native population 15 years and over
Males 17.2% Never married82.8% Now married0.0% Separated0.0% Widowed0.0% DivorcedFemales 19.0% Never married70.3% Now married10.8% Separated0.0% Widowed0.0% DivorcedWomen who did not give birth in the past 12 months Now married:
45.5% (29)Unmarried:
54.5% (35)
Marital status - Asian population 15 years and over
Males 59.3% Never married37.3% Now married0.6% Separated0.6% Widowed2.1% DivorcedFemales 54.5% Never married38.4% Now married1.1% Separated1.8% Widowed4.2% DivorcedWomen who gave birth in the past 12 months Now married:
100.0% (186)Unmarried:
0.0% (0)
Women who did not give birth in the past 12 months Now married:
35.2% (1,226)Unmarried:
64.8% (2,256)
Marital status - Native Hawaiian / Pacific Islander population 15 years and over
Males 0.0% Never married100.0% Now married0.0% Separated0.0% Widowed0.0% DivorcedFemales 45.5% Never married0.0% Now married0.0% Separated0.0% Widowed54.5% DivorcedWomen who did not give birth in the past 12 months Now married:
0.0% (0)Unmarried:
100.0% (5)
Marital status - Other race population 15 years and over
Males 56.9% Never married35.3% Now married1.9% Separated0.7% Widowed5.2% DivorcedFemales 34.3% Never married43.3% Now married3.5% Separated11.7% Widowed7.1% DivorcedWomen who gave birth in the past 12 months Now married:
0.0% (0)Unmarried:
100.0% (12)
Women who did not give birth in the past 12 months Now married:
53.6% (444)Unmarried:
46.4% (384)
Marital status - Two or more races population 15 years and over
Males 60.5% Never married32.5% Now married0.0% Separated0.0% Widowed7.0% DivorcedFemales 50.5% Never married29.9% Now married4.2% Separated5.7% Widowed9.7% DivorcedWomen who gave birth in the past 12 months Now married:
100.0% (321)Unmarried:
0.0% (0)
Women who did not give birth in the past 12 months Now married:
29.5% (616)Unmarried:
70.5% (1,469)
Marital status - White alone, not Hispanic / Latino population 15 years and over
Males 64.6% Never married29.1% Now married0.0% Separated1.1% Widowed5.1% DivorcedFemales 60.2% Never married27.5% Now married0.5% Separated4.5% Widowed7.3% DivorcedWomen who gave birth in the past 12 months Now married:
93.0% (370)Unmarried:
7.0% (28)
Women who did not give birth in the past 12 months Now married:
21.4% (4,013)Unmarried:
78.6% (14,711)
Marital status - Hispanic or Latino population 15 years and over
Males 56.6% Never married36.3% Now married0.8% Separated0.3% Widowed6.0% DivorcedFemales 46.6% Never married40.2% Now married4.1% Separated4.4% Widowed4.7% DivorcedWomen who gave birth in the past 12 months Now married:
62.7% (53)Unmarried:
37.3% (32)
Women who did not give birth in the past 12 months Now married:
38.3% (958)Unmarried:
61.7% (1,545)
Ancestries in Somerville
3,652 9.8% Irish3,070 8.2% Italian1,984 5.3% Brazilian1,882 5.1% Portuguese1,171 3.1% English968 2.6% German908 2.4% European813 2.2% American645 1.7% Haitian452 1.2% Dutch442 1.2% Polish407 1.1% Eastern European325 0.9% Bulgarian325 0.9% French Canadian230 0.6% Greek206 0.6% Jamaican205 0.6% Canadian205 0.6% Russian179 0.5% Ukrainian172 0.5% African162 0.4% Turkish159 0.4% Lebanese154 0.4% French143 0.4% Moroccan135 0.4% Albanian135 0.4% Armenian125 0.3% Scottish120 0.3% Egyptian116 0.3% British102 0.3% Hungarian102 0.3% Cape Verdean101 0.3% Swedish95 0.3% Northern European91 0.2% Australian90 0.2% Ghanaian80 0.2% Latvian74 0.2% Ethiopian74 0.2% Finnish74 0.2% Romanian64 0.2% Norwegian63 0.2% Scotch-Irish61 0.2% Iranian53 0.1% Swiss49 0.1% Cypriot49 0.1% Nigerian34 0.09% Slovak32 0.09% Welsh32 0.09% Yugoslavian27 0.07% Lithuanian26 0.07% Carpatho Rusyn25 0.07% British West Indian23 0.06% Alsatian20 0.05% Kenyan19 0.05% Syrian18 0.05% Senegalese17 0.05% Belgian16 0.04% Czech15 0.04% Czechoslovakian13 0.03% Austrian12 0.03% Scandinavian12 0.03% West Indian11 0.03% Celtic9 0.02% Palestinian6 0.02% Iraqi6 0.02% Serbian3 0.01% Arab3 0.01% Barbadian2 0.01% Somali
Geographical mobility in Somerville Same house 1 year ago 41,934 73.1% White (Caucasian)3,032 83.9% Black or African American280 93.6% American Indian / Alaska Native6,470 73.6% Asian12 61.8% Native Hawaiian / Pacific Islander3,375 86.7% Other race5,103 70.8% Two or more races40,038 73.3% White alone, not Hispanic / Latino3,952 71.0% Hispanic or LatinoMoved within same county 6,095 10.6% White / Caucasian87 2.4% Black or African American12 3.8% American Indian / Alaska Native756 8.6% Asian138 3.6% Other race1,348 18.7% Two or more races5,967 10.9% White alone, not Hispanic / Latino589 10.6% Hispanic or LatinoMoved within same state 5,576 9.7% White / Caucasian401 11.1% Black or African American11 3.5% American Indian / Alaska Native562 6.4% Asian8 40.8% Native Hawaiian / Pacific Islander192 4.9% Other race137 1.9% Two or more races4,965 9.1% White alone, not Hispanic / Latino682 12.3% Hispanic or LatinoMoved from different state 3,265 5.7% White / Caucasian94 2.6% Black or African American1 0.3% American Indian / Alaska Native388 4.4% Asian49 1.3% Other race277 3.8% Two or more races3,221 5.9% White alone, not Hispanic / Latino143 2.6% Hispanic or LatinoMoved from abroad 502 0.9% White611 7.0% Asian37 1.0% Other race342 4.7% Two or more races446 0.8% White alone, not Hispanic / Latino199 3.6% Hispanic or Latino
Children Nativity (place of birth) in Somerville
Children under 6 years - Living with two parents Both parents native 1,611 100.0% NativeBoth parents foreign-born 545 75.4% Native178 24.6% Foreign-bornOne native, one foreign-born parent 514 100.0% NativeChildren under 6 years - Living with one parent Native parent 217 100.0% NativeForeign-born parent 371 99.4% Native2 0.6% Foreign-bornChildren 6 to 17 years - Living with two parents Both parents native 1,451 98.6% Native21 1.4% Foreign-bornBoth parents foreign-born 643 80.7% Native154 19.3% Foreign-bornOne native, one foreign-born parent 563 100.0% NativeChildren 6 to 17 years - Living with one parent Native parent 296 100.0% NativeForeign-born parent 1,032 58.0% Native746 42.0% Foreign-born
Place of birth for residents in Somerville 8,413 Americas7,422 Latin America5,846 Asia4,499 Europe3,230 South America2,879 Central America2,447 Eastern Asia2,224 South Central Asia2,184 Southern Europe1,654 China1,312 Caribbean1,022 Eastern Europe990 Northern America834 Western Europe733 Africa706 South Eastern Asia467 Western Asia458 Northern Europe277 Western Africa191 Oceania191 Australia and New Zealand Subregion158 Eastern Africa125 Northern Africa42 Southern Africa22 Middle Africa2,449 Brazil2,266 El Salvador1,529 Portugal1,471 China1,333 India990 Canada592 Nepal583 Haiti553 Korea434 Dominican Republic386 Italy371 Guatemala366 Netherlands248 Colombia244 Azores Islands241 Germany226 Philippines225 Bulgaria222 United Kingdom221 Japan221 Vietnam200 France188 Russia179 Australia174 Spain154 Mexico153 Turkey149 Hungary138 Saudi Arabia137 Ireland133 Jamaica122 Venezuela104 Ghana95 Poland94 Taiwan93 Greece89 Morocco88 Hong Kong87 Thailand86 Bangladesh82 England82 Cabo Verde70 Latvia69 Nigeria69 Ecuador68 Indonesia68 Singapore66 Peru64 Ukraine59 Guyana57 Bolivia51 Israel47 Ethiopia47 Sri Lanka45 Honduras42 South Africa41 Belarus39 Czechoslovakia35 Uruguay34 Malaysia32 Barbados32 Eritrea31 Egypt31 Kenya31 Dominica31 Uzbekistan31 Chile29 Romania26 Albania26 Costa Rica26 Iran24 Azerbaijan22 United Arab Emirates22 Cameroon17 Switzerland15 Kazakhstan14 Armenia14 Nicaragua12 Cuba12 Iraq11 New Zealand10 Norway10 Grenada10 Pakistan10 Tanzania9 Lebanon8 Moldova8 Belgium5 Sweden2 Somalia
Grandparents responsible for own grandchildren in Somerville
Grandparents (30 to 59 years) White / Caucasian 19 53.5% Responsible for grandchildren17 46.5% Not responsible for grandchildrenBlack or African American 2 100.0% Responsible for grandchildrenAsian 10 41.7% Responsible for grandchildren14 58.3% Not responsible for grandchildrenOther race 149 100.0% Not responsible for grandchildrenTwo or more races 24 100.0% Not responsible for grandchildrenWhite alone, not Hispanic / Latino 21 54.1% Responsible for grandchildren18 45.9% Not responsible for grandchildrenHispanic or Latino 54 100.0% Not responsible for grandchildrenGrandparents (60 years and over) White / Caucasian 95 27.2% Responsible for grandchildren255 72.8% Not responsible for grandchildrenBlack or African American 64 100.0% Not responsible for grandchildrenAsian 49 67.3% Responsible for grandchildren24 32.7% Not responsible for grandchildrenOther race 41 47.6% Responsible for grandchildren45 52.4% Not responsible for grandchildrenTwo or more races 11 52.9% Responsible for grandchildren10 47.1% Not responsible for grandchildrenWhite alone, not Hispanic / Latino 94 32.3% Responsible for grandchildren197 67.7% Not responsible for grandchildrenHispanic or Latino 48 35.0% Responsible for grandchildren89 65.0% Not responsible for grandchildren