Races in Taunton, Massachusetts (MA) Detailed Stats
Data:
Races - White alone (%)
Races - White alone (% change since 2000)
Races - Black alone (%)
Races - Black alone (% change since 2000)
Races - American Indian alone (%)
Races - American Indian alone (% change since 2000)
Races - Asian alone (%)
Races - Asian alone (% change since 2000)
Races - Hispanic (%)
Races - Hispanic (% change since 2000)
Races - Native Hawaiian and Other Pacific Islander alone (%)
Races - Native Hawaiian and Other Pacific Islander alone (% change since 2000)
Races - Two or more races(%)
Races - Two or more races(% change since 2000)
Races - Other race alone (%)
Races - Other race alone (% change since 2000)
Racial diversity
Place of birth - Born in state of residence (%)
Place of birth - Born in state of residence (%) - White
Place of birth - Born in state of residence (%) - Black or African American
Place of birth - Born in state of residence (%) - Asian
Place of birth - Born in state of residence (%) - Hispanic or Latino
Place of birth - Born in state of residence (%) - American Indian and Alaska Native
Place of birth - Born in state of residence (%) - Multirace
Place of birth - Born in state of residence (%) - Other Race
Place of birth - Born in other state (%)
Place of birth - Born in other state (%) - White
Place of birth - Born in other state (%) - Black or African American
Place of birth - Born in other state (%) - Asian
Place of birth - Born in other state (%) - Hispanic or Latino
Place of birth - Born in other state (%) - American Indian and Alaska Native
Place of birth - Born in other state (%) - Multirace
Place of birth - Born in other state (%) - Other Race
Place of birth - Native, outside of US (%)
Place of birth - Native, outside of US (%) - White
Place of birth - Native, outside of US (%) - Black or African American
Place of birth - Native, outside of US (%) - Asian
Place of birth - Native, outside of US (%) - Hispanic or Latino
Place of birth - Native, outside of US (%) - American Indian and Alaska Native
Place of birth - Native, outside of US (%) - Multirace
Place of birth - Native, outside of US (%) - Other Race
Place of birth - Foreign born (%)
Place of birth - Foreign born (%) - White
Place of birth - Foreign born (%) - Black or African American
Place of birth - Foreign born (%) - Asian
Place of birth - Foreign born (%) - Hispanic or Latino
Place of birth - Foreign born (%) - American Indian and Alaska Native
Place of birth - Foreign born (%) - Multirace
Place of birth - Foreign born (%) - Other Race
Residents speaking English at home (%)
Residents speaking English at home - Born in the United States (%)
Residents speaking English at home - Native, born elsewhere (%)
Residents speaking English at home - Foreign born (%)
Residents speaking Spanish at home (%)
Residents speaking Spanish at home - Born in the United States (%)
Residents speaking Spanish at home - Native, born elsewhere (%)
Residents speaking Spanish at home - Foreign born (%)
Residents speaking other language at home (%)
Residents speaking other language at home - Born in the United States (%)
Residents speaking other language at home - Native, born elsewhere (%)
Residents speaking other language at home - Foreign born (%)
Marital status - Never married (%)
Marital status - Now married (%)
Marital status - Separated (%)
Marital status - Widowed (%)
Marital status - Divorced (%)
Ancestries Reported - Arab (%)
Ancestries Reported - Czech (%)
Ancestries Reported - Danish (%)
Ancestries Reported - Dutch (%)
Ancestries Reported - English (%)
Ancestries Reported - French (%)
Ancestries Reported - French Canadian (%)
Ancestries Reported - German (%)
Ancestries Reported - Greek (%)
Ancestries Reported - Hungarian (%)
Ancestries Reported - Irish (%)
Ancestries Reported - Italian (%)
Ancestries Reported - Lithuanian (%)
Ancestries Reported - Norwegian (%)
Ancestries Reported - Polish (%)
Ancestries Reported - Portuguese (%)
Ancestries Reported - Russian (%)
Ancestries Reported - Scotch-Irish (%)
Ancestries Reported - Scottish (%)
Ancestries Reported - Slovak (%)
Ancestries Reported - Subsaharan African (%)
Ancestries Reported - Swedish (%)
Ancestries Reported - Swiss (%)
Ancestries Reported - Ukrainian (%)
Ancestries Reported - United States (%)
Ancestries Reported - Welsh (%)
Ancestries Reported - West Indian (%)
Ancestries Reported - Other (%)
Geographical mobility - Same house 1 year ago (%)
Geographical mobility - Same house 1 year ago (%) - White
Geographical mobility - Same house 1 year ago (%) - Black or African American
Geographical mobility - Same house 1 year ago (%) - Asian
Geographical mobility - Same house 1 year ago (%) - Hispanic or Latino
Geographical mobility - Same house 1 year ago (%) - American Indian and Alaska Native
Geographical mobility - Same house 1 year ago (%) - Multirace
Geographical mobility - Same house 1 year ago (%) - Other Race
Geographical mobility - Moved within same county (%)
Geographical mobility - Moved within same county (%) - White
Geographical mobility - Moved within same county (%) - Black or African American
Geographical mobility - Moved within same county (%) - Asian
Geographical mobility - Moved within same county (%) - Hispanic or Latino
Geographical mobility - Moved within same county (%) - American Indian and Alaska Native
Geographical mobility - Moved within same county (%) - Multirace
Geographical mobility - Moved within same county (%) - Other Race
Geographical mobility - Moved from different county within same state (%)
Geographical mobility - Moved from different county within same state (%) - White
Geographical mobility - Moved from different county within same state (%) - Black or African American
Geographical mobility - Moved from different county within same state (%) - Asian
Geographical mobility - Moved from different county within same state (%) - Hispanic or Latino
Geographical mobility - Moved from different county within same state (%) - American Indian and Alaska Native
Geographical mobility - Moved from different county within same state (%) - Multirace
Geographical mobility - Moved from different county within same state (%) - Other Race
Geographical mobility - Moved from different state (%)
Geographical mobility - Moved from different state (%) - White
Geographical mobility - Moved from different state (%) - Black or African American
Geographical mobility - Moved from different state (%) - Asian
Geographical mobility - Moved from different state (%) - Hispanic or Latino
Geographical mobility - Moved from different state (%) - American Indian and Alaska Native
Geographical mobility - Moved from different state (%) - Multirace
Geographical mobility - Moved from different state (%) - Other Race
Geographical mobility - Moved from abroad (%)
Geographical mobility - Moved from abroad (%) - White
Geographical mobility - Moved from abroad (%) - Black or African American
Geographical mobility - Moved from abroad (%) - Asian
Geographical mobility - Moved from abroad (%) - Hispanic or Latino
Geographical mobility - Moved from abroad (%) - American Indian and Alaska Native
Geographical mobility - Moved from abroad (%) - Multirace
Geographical mobility - Moved from abroad (%) - Other Race
Place of birth for the foreign-born population - Ireland (%)
Place of birth for the foreign-born population - Denmark (%)
Place of birth for the foreign-born population - Norway (%)
Place of birth for the foreign-born population - Sweden (%)
Place of birth for the foreign-born population - United Kingdom (%)
Place of birth for the foreign-born population - England (%)
Place of birth for the foreign-born population - Scotland (%)
Place of birth for the foreign-born population - Other Northern Europe (%)
Place of birth for the foreign-born population - Austria (%)
Place of birth for the foreign-born population - Belgium (%)
Place of birth for the foreign-born population - France (%)
Place of birth for the foreign-born population - Germany (%)
Place of birth for the foreign-born population - Netherlands (%)
Place of birth for the foreign-born population - Switzerland (%)
Place of birth for the foreign-born population - Other Western Europe (%)
Place of birth for the foreign-born population - Greece (%)
Place of birth for the foreign-born population - Italy (%)
Place of birth for the foreign-born population - Portugal (%)
Place of birth for the foreign-born population - Spain (%)
Place of birth for the foreign-born population - Other Southern Europe (%)
Place of birth for the foreign-born population - Albania (%)
Place of birth for the foreign-born population - Belarus (%)
Place of birth for the foreign-born population - Bosnia and Herzegovina (%)
Place of birth for the foreign-born population - Bulgaria (%)
Place of birth for the foreign-born population - Croatia (%)
Place of birth for the foreign-born population - Czechoslovakia (%)
Place of birth for the foreign-born population - Hungary (%)
Place of birth for the foreign-born population - Latvia (%)
Place of birth for the foreign-born population - Lithuania (%)
Place of birth for the foreign-born population - North Macedonia (Macedonia) (%)
Place of birth for the foreign-born population - Moldova (%)
Place of birth for the foreign-born population - Poland (%)
Place of birth for the foreign-born population - Romania (%)
Place of birth for the foreign-born population - Russia (%)
Place of birth for the foreign-born population - Serbia (%)
Place of birth for the foreign-born population - Ukraine (%)
Place of birth for the foreign-born population - Other Eastern Europe (%)
Place of birth for the foreign-born population - China (%)
Place of birth for the foreign-born population - Hong Kong (%)
Place of birth for the foreign-born population - Taiwan (%)
Place of birth for the foreign-born population - Japan (%)
Place of birth for the foreign-born population - Korea (%)
Place of birth for the foreign-born population - Other Eastern Asia (%)
Place of birth for the foreign-born population - Afghanistan (%)
Place of birth for the foreign-born population - Bangladesh (%)
Place of birth for the foreign-born population - India (%)
Place of birth for the foreign-born population - Iran (%)
Place of birth for the foreign-born population - Kazakhstan (%)
Place of birth for the foreign-born population - Nepal (%)
Place of birth for the foreign-born population - Pakistan (%)
Place of birth for the foreign-born population - Sri Lanka (%)
Place of birth for the foreign-born population - Uzbekistan (%)
Place of birth for the foreign-born population - Other South Central Asia (%)
Place of birth for the foreign-born population - Burma (%)
Place of birth for the foreign-born population - Cambodia (%)
Place of birth for the foreign-born population - Indonesia (%)
Place of birth for the foreign-born population - Laos (%)
Place of birth for the foreign-born population - Malaysia (%)
Place of birth for the foreign-born population - Philippines (%)
Place of birth for the foreign-born population - Singapore (%)
Place of birth for the foreign-born population - Thailand (%)
Place of birth for the foreign-born population - Vietnam (%)
Place of birth for the foreign-born population - Other South Eastern Asia (%)
Place of birth for the foreign-born population - Armenia (%)
Place of birth for the foreign-born population - Iraq (%)
Place of birth for the foreign-born population - Israel (%)
Place of birth for the foreign-born population - Jordan (%)
Place of birth for the foreign-born population - Kuwait (%)
Place of birth for the foreign-born population - Lebanon (%)
Place of birth for the foreign-born population - Saudi Arabia (%)
Place of birth for the foreign-born population - Syria (%)
Place of birth for the foreign-born population - Turkey (%)
Place of birth for the foreign-born population - Yemen (%)
Place of birth for the foreign-born population - Other Western Asia (%)
Place of birth for the foreign-born population - Eritrea (%)
Place of birth for the foreign-born population - Ethiopia (%)
Place of birth for the foreign-born population - Kenya (%)
Place of birth for the foreign-born population - Somalia (%)
Place of birth for the foreign-born population - Uganda (%)
Place of birth for the foreign-born population - Zimbabwe (%)
Place of birth for the foreign-born population - Other Eastern Africa (%)
Place of birth for the foreign-born population - Cameroon (%)
Place of birth for the foreign-born population - Congo (%)
Place of birth for the foreign-born population - Democratic Republic of Congo (Zaire) (%)
Place of birth for the foreign-born population - Other Middle Africa (%)
Place of birth for the foreign-born population - Egypt (%)
Place of birth for the foreign-born population - Morocco (%)
Place of birth for the foreign-born population - Sudan (%)
Place of birth for the foreign-born population - Other Northern Africa (%)
Place of birth for the foreign-born population - South Africa (%)
Place of birth for the foreign-born population - Other Southern Africa (%)
Place of birth for the foreign-born population - Cabo Verde (%)
Place of birth for the foreign-born population - Ghana (%)
Place of birth for the foreign-born population - Liberia (%)
Place of birth for the foreign-born population - Nigeria (%)
Place of birth for the foreign-born population - Senegal (%)
Place of birth for the foreign-born population - Sierra Leone (%)
Place of birth for the foreign-born population - Other Western Africa (%)
Place of birth for the foreign-born population - Australia (%)
Place of birth for the foreign-born population - New Zealand (%)
Place of birth for the foreign-born population - Fiji (%)
Place of birth for the foreign-born population - Micronesia (%)
Place of birth for the foreign-born population - Bahamas (%)
Place of birth for the foreign-born population - Barbados (%)
Place of birth for the foreign-born population - Cuba (%)
Place of birth for the foreign-born population - Dominica (%)
Place of birth for the foreign-born population - Dominican Republic (%)
Place of birth for the foreign-born population - Grenada (%)
Place of birth for the foreign-born population - Haiti (%)
Place of birth for the foreign-born population - Jamaica (%)
Place of birth for the foreign-born population - St. Vincent and the Grenadines (%)
Place of birth for the foreign-born population - Trinidad and Tobago (%)
Place of birth for the foreign-born population - West Indies (%)
Place of birth for the foreign-born population - Other Caribbean (%)
Place of birth for the foreign-born population - Belize (%)
Place of birth for the foreign-born population - Costa Rica (%)
Place of birth for the foreign-born population - El Salvador (%)
Place of birth for the foreign-born population - Guatemala (%)
Place of birth for the foreign-born population - Honduras (%)
Place of birth for the foreign-born population - Mexico (%)
Place of birth for the foreign-born population - Nicaragua (%)
Place of birth for the foreign-born population - Panama (%)
Place of birth for the foreign-born population - Other Central America (%)
Place of birth for the foreign-born population - Argentina (%)
Place of birth for the foreign-born population - Bolivia (%)
Place of birth for the foreign-born population - Brazil (%)
Place of birth for the foreign-born population - Chile (%)
Place of birth for the foreign-born population - Colombia (%)
Place of birth for the foreign-born population - Ecuador (%)
Place of birth for the foreign-born population - Guyana (%)
Place of birth for the foreign-born population - Peru (%)
Place of birth for the foreign-born population - Uruguay (%)
Place of birth for the foreign-born population - Venezuela (%)
Place of birth for the foreign-born population - Other South America (%)
Place of birth for the foreign-born population - Canada (%)
Place of birth for the foreign-born population - Other Northern America (%)
Place of birth for the foreign-born population - Other (%)
Latest news about races in Taunton, MA collected exclusively by city-data.com from local newspapers, TV, and radio stations
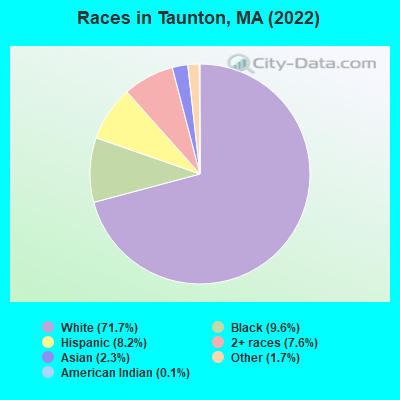
According to 2022 data, the most numerous races in Taunton, MA are White alone (42,861 residents), Hispanic (4,915 residents), and Asian alone (1,387 residents). 78.8% of Taunton residents speak English at home. 15.1% of Taunton, MA residents are foreign-born (5.9% born in Europe, 4.5% born in Latin America, 2.7% born in Africa, 1.5% born in Asia), which is 19.3% less than the foreign-born rate of 18.0% across the entire state of Massachusetts.
Race distribution in Taunton
2000 2022
50,272 89.8% White alone 2,198 3.9% Hispanic 1,366 2.4% Black alone 1,068 1.9% Two or more races 664 1.2% Other race alone 322 0.6% Asian alone 69 0.1% American Indian alone 17 0.03% Native Hawaiian and Other
42,861 71.7% White alone 5,757 9.6% Black alone 4,915 8.2% Hispanic 4,522 7.6% Two or more races 1,387 2.3% Asian alone 1,027 1.7% Other race alone 64 0.1% American Indian alone
2000 2022
5,198,359 81.9% White alone 428,729 6.8% Hispanic 318,329 5.0% Black alone 236,786 3.7% Asian alone 110,338 1.7% Two or more races 43,586 0.7% Other race alone 11,264 0.2% American Indian alone 1,706 0.03% Native Hawaiian and Other
4,676,627 67.0% White alone 911,038 13.0% Hispanic 501,463 7.2% Asian alone 459,740 6.6% Black alone 341,889 4.9% Two or more races 84,403 1.2% Other race alone 5,838 0.08% American Indian alone 976 0.01% Native Hawaiian and Other
Income and house value in Taunton Median household income in 2022 $78,617 White non-Hispanic householders$56,882 Black householders$122,429 American Indian and Alaska Native householders$109,711 Asian householders$85,406 Some other race householders$74,736 Two or more races householders$56,419 Hispanic or Latino race householdersMedian 2022 house value $416,519 White Non-Hispanic householders$405,956 Black or African American householders$321,168 American Indian or Alaska Native householders $436,503 Asian householders$445,352 Some other race householders$366,274 Two or more races householders$397,962 Hispanic or Latino householders
Median age by race in Taunton
44.7 Median age for White residents41.4 47.9 26.3 Median age for Black or African American residents24.0 28.5 30.8 Median age for American Indian / Alaska Native residents34.0 22.1 36.4 Median age for Asian residents33.2 36.8 -319,845,857.1 Median age for Native Hawaiian / Pacific Islander residents-666,666,666.0 -508,717,948.2 28.1 Median age for Other race residents19.0 34.2 38.4 Median age for Two or more races residents37.8 35.1 45.1 Median age for White alone residents42.1 48.0 27.2 Median age for Hispanic or Latino residents23.3 27.6
Owner/renter occupied households by race in Taunton
House owners and renters - White residents 12,494 65.0% Owner occupied6,721 35.0% Renter occupiedHouse owners and renters - Black or African American residents 944 48.0% Owner occupied1,021 52.0% Renter occupiedHouse owners and renters - American Indian / Alaska Native residents 49 46.2% Owner occupied57 53.8% Renter occupiedHouse owners and renters - Asian residents 215 63.5% Owner occupied123 36.5% Renter occupiedHouse owners and renters - Other race residents 242 43.9% Owner occupied310 56.1% Renter occupiedHouse owners and renters - Two or more races residents 1,330 55.9% Owner occupied1,047 44.1% Renter occupiedHouse owners and renters - White alone residents 12,434 65.9% Owner occupied6,441 34.1% Renter occupiedHouse owners and renters - Hispanic or Latino residents 389 27.5% Owner occupied1,025 72.5% Renter occupied
Language usage in Taunton
English speakers - Total 78.8% of residents of Taunton speak English at home.
4.2% of residents speak Spanish at home 1,636 68.5% Speak English very well753 31.5% Speak English less than very well16.9% of residents speak other language at home 5,790 60.5% Speak English very well3,781 39.5% Speak English less than very well
English speakers - Born in the United States 89.2% of residents of Taunton speak English at home.
4.8% of residents speak Spanish at home 210 80.2% Speak English very well52 19.8% Speak English less than very well5.1% of residents speak other language at home 275 97.9% Speak English very well6 2.1% Speak English less than very well
English speakers - Native, born elsewhere 40.5% of residents of Taunton speak English at home.
49.7% of residents speak Spanish at home 600 61.2% Speak English very well381 38.8% Speak English less than very well12.4% of residents speak other language at home 229 93.9% Speak English very well15 6.1% Speak English less than very well
English speakers - Foreign-born 14.0% of residents of Taunton speak English at home.
5.8% of residents speak Spanish at home 288 55.0% Speak English very well236 45.0% Speak English less than very well79.8% of residents speak other language at home 3,693 51.2% Speak English very well3,526 48.8% Speak English less than very well
White (Caucasian) - Speak only English Native:
94.6% (36,078)Foreign-born:
17.5% (683)
White (Caucasian) - Speak another language Native:
5.4% (2,064)Foreign-born:
82.0% (3,205)
Black or African American - Speak only English Native:
94.0% (3,408)Foreign-born:
9.4% (173)
Black or African American - Speak another language Native:
7.8% (282)Foreign-born:
95.0% (1,747)
American Indian / Alaska Native - Speak only English Native:
39.2% (65)Foreign-born:
53.7% (12)
Asian - Speak only English Native:
55.9% (163)Foreign-born:
12.3% (115)
Asian - Speak another language Native:
43.5% (127)Foreign-born:
87.6% (816)
Other race - Speak only English Native:
75.9% (797)Foreign-born:
11.6% (61)
Other race - Speak another language Native:
31.9% (335)Foreign-born:
89.4% (475)
Two or more races - Speak only English Native:
67.9% (3,182)Foreign-born:
13.6% (299)
Two or more races - Speak another language Native:
31.2% (1,464)Foreign-born:
86.9% (1,912)
White alone - Speak only English Native:
96.2% (35,687)Foreign-born:
16.5% (645)
White alone - Speak another language Native:
4.1% (1,508)Foreign-born:
82.9% (3,230)
Hispanic or Latino - Speak only English Native:
46.7% (1,641)Foreign-born:
37.7% (285)
Hispanic or Latino - Speak another language Native:
53.8% (1,887)Foreign-born:
72.3% (546)
Foreign-born residents in Taunton 9,018 residents are foreign born (5.9% Europe , 4.5% Latin America , 2.7% Africa , 1.5% Asia ).
This city:
15.1%Massachusetts:
17.6%
Marital status for residents in Taunton Marital status - White (Caucasian) population 15 years and over
Males 40.3% Never married45.9% Now married1.9% Separated2.5% Widowed9.3% DivorcedFemales 31.9% Never married41.2% Now married1.5% Separated11.1% Widowed14.3% DivorcedWomen who gave birth in the past 12 months Now married:
67.9% (405)Unmarried:
32.1% (191)
Women who did not give birth in the past 12 months Now married:
37.0% (3,298)Unmarried:
63.0% (5,619)
Marital status - Black or African American population 15 years and over
Males 47.5% Never married37.7% Now married6.1% Separated0.3% Widowed8.5% DivorcedFemales 28.0% Never married41.7% Now married5.4% Separated8.7% Widowed16.1% DivorcedWomen who gave birth in the past 12 months Now married:
47.1% (11)Unmarried:
52.9% (13)
Women who did not give birth in the past 12 months Now married:
41.7% (460)Unmarried:
58.3% (644)
Marital status - American Indian / Alaska Native population 15 years and over
Males 43.5% Never married42.4% Now married0.0% Separated0.0% Widowed14.1% DivorcedFemales 75.8% Never married0.0% Now married24.2% Separated0.0% Widowed0.0% DivorcedWomen who did not give birth in the past 12 months Now married:
0.0% (0)Unmarried:
100.0% (59)
Marital status - Asian population 15 years and over
Males 18.6% Never married78.0% Now married0.0% Separated0.0% Widowed3.5% DivorcedFemales 23.4% Never married71.8% Now married0.0% Separated1.9% Widowed3.0% DivorcedWomen who gave birth in the past 12 months Now married:
100.0% (20)Unmarried:
0.0% (0)
Women who did not give birth in the past 12 months Now married:
65.2% (276)Unmarried:
34.8% (147)
Marital status - Other race population 15 years and over
Males 56.1% Never married20.4% Now married8.0% Separated7.5% Widowed8.0% DivorcedFemales 31.8% Never married26.8% Now married13.1% Separated1.5% Widowed26.8% DivorcedWomen who did not give birth in the past 12 months Now married:
35.5% (181)Unmarried:
64.5% (329)
Marital status - Two or more races population 15 years and over
Males 31.8% Never married62.3% Now married2.4% Separated0.0% Widowed3.4% DivorcedFemales 39.4% Never married51.9% Now married1.8% Separated1.9% Widowed5.0% DivorcedWomen who gave birth in the past 12 months Now married:
91.8% (81)Unmarried:
8.2% (7)
Women who did not give birth in the past 12 months Now married:
47.1% (1,026)Unmarried:
52.9% (1,150)
Marital status - White alone, not Hispanic / Latino population 15 years and over
Males 40.1% Never married45.9% Now married1.8% Separated2.6% Widowed9.6% DivorcedFemales 31.3% Never married41.6% Now married1.5% Separated11.1% Widowed14.5% DivorcedWomen who gave birth in the past 12 months Now married:
66.5% (377)Unmarried:
33.5% (190)
Women who did not give birth in the past 12 months Now married:
38.2% (3,324)Unmarried:
61.8% (5,384)
Marital status - Hispanic or Latino population 15 years and over
Males 41.1% Never married50.1% Now married5.6% Separated1.6% Widowed1.5% DivorcedFemales 49.0% Never married35.7% Now married0.0% Separated9.9% Widowed5.4% DivorcedWomen who gave birth in the past 12 months Now married:
80.4% (50)Unmarried:
19.6% (12)
Women who did not give birth in the past 12 months Now married:
31.4% (354)Unmarried:
68.6% (772)
Ancestries in Taunton
6,172 22.8% Portuguese3,696 13.7% Irish1,825 6.7% American1,648 6.1% Italian1,615 6.0% Cape Verdean1,035 3.8% English819 3.0% Brazilian749 2.8% Haitian477 1.8% French463 1.7% Polish371 1.4% Albanian262 1.0% French Canadian234 0.9% German232 0.9% Greek191 0.7% European179 0.7% African139 0.5% Russian130 0.5% Scottish111 0.4% Romanian44 0.2% Syrian42 0.2% Lebanese40 0.1% Norwegian35 0.1% British35 0.1% Swedish33 0.1% Nigerian31 0.1% Jamaican27 0.10% Canadian27 0.10% Finnish26 0.10% Kenyan24 0.09% Trinidadian and Tobagonian23 0.08% Bulgarian18 0.07% Austrian17 0.06% Scotch-Irish15 0.06% Ukrainian13 0.05% Lithuanian12 0.04% Turkish11 0.04% Dutch4 0.01% Barbadian3 0.01% Welsh
Geographical mobility in Taunton Same house 1 year ago 39,503 90.3% White (Caucasian)5,386 90.3% Black or African American148 69.7% American Indian / Alaska Native1,275 93.6% Asian1,184 73.6% Other race5,645 78.3% Two or more races38,600 90.8% White alone, not Hispanic / Latino3,932 82.1% Hispanic or LatinoMoved within same county 1,783 4.1% White / Caucasian130 2.2% Black or African American45 21.2% American Indian / Alaska Native37 2.7% Asian375 23.3% Other race219 3.0% Two or more races1,719 4.0% White alone, not Hispanic / Latino471 9.8% Hispanic or LatinoMoved within same state 1,850 4.2% White / Caucasian335 5.6% Black or African American29 2.1% Asian29 1.8% Other race754 10.5% Two or more races1,859 4.4% White alone, not Hispanic / Latino56 1.2% Hispanic or LatinoMoved from different state 549 1.3% White / Caucasian131 2.2% Black or African American16 1.2% Asian31 1.9% Other race378 5.2% Two or more races290 0.7% White alone, not Hispanic / Latino376 7.9% Hispanic or LatinoMoved from abroad 39 0.1% White6 0.5% Asian106 1.5% Two or more races45 0.1% White alone, not Hispanic / Latino
Children Nativity (place of birth) in Taunton
Children under 6 years - Living with two parents Both parents native 1,401 100.0% NativeBoth parents foreign-born 334 100.0% NativeOne native, one foreign-born parent 378 100.0% NativeChildren under 6 years - Living with one parent Native parent 1,182 100.0% NativeForeign-born parent 146 100.0% NativeChildren 6 to 17 years - Living with two parents Both parents native 2,189 100.0% NativeBoth parents foreign-born 872 75.1% Native289 24.9% Foreign-bornOne native, one foreign-born parent 351 100.0% NativeChildren 6 to 17 years - Living with one parent Native parent 3,477 100.0% NativeForeign-born parent 736 53.2% Native647 46.8% Foreign-born
Place of birth for residents in Taunton 3,572 Europe2,925 Southern Europe2,867 Americas2,759 Latin America1,639 Africa1,460 Western Africa1,426 South America1,144 Caribbean937 Asia456 Eastern Europe391 Eastern Asia363 China319 South Eastern Asia188 Central America184 South Central Asia113 Middle Africa108 Northern America101 Western Europe89 Northern Europe42 Western Asia40 Eastern Africa25 Northern Africa2,778 Portugal1,406 Cabo Verde1,149 Brazil719 Haiti482 Azores Islands363 China248 Dominican Republic228 Albania212 Vietnam184 India108 Greece99 Guatemala94 Colombia92 Romania89 Germany82 Cameroon77 Bahamas75 Guyana70 Canada67 Poland51 Peru50 Costa Rica48 Cambodia44 Russia41 Ecuador40 Kenya40 Trinidad and Tobago37 Spain37 Philippines36 Ireland34 United Kingdom34 Nigeria34 Jamaica28 Panama25 Morocco23 Bulgaria23 Cuba18 Lebanon18 Liberia16 Japan12 Netherlands12 Korea12 Syria12 Chile11 Turkey10 England10 Burma (Myanmar)10 Indonesia10 Nicaragua
Grandparents responsible for own grandchildren in Taunton
Grandparents (30 to 59 years) White / Caucasian 401 75.3% Responsible for grandchildren131 24.7% Not responsible for grandchildrenTwo or more races 364 91.5% Responsible for grandchildren34 8.5% Not responsible for grandchildrenWhite alone, not Hispanic / Latino 373 73.9% Responsible for grandchildren132 26.1% Not responsible for grandchildrenHispanic or Latino 11 100.0% Responsible for grandchildrenGrandparents (60 years and over) White / Caucasian 303 40.0% Responsible for grandchildren455 60.0% Not responsible for grandchildrenTwo or more races 98 100.0% Not responsible for grandchildrenWhite alone, not Hispanic / Latino 301 39.5% Responsible for grandchildren460 60.5% Not responsible for grandchildrenHispanic or Latino 8 34.7% Responsible for grandchildren15 65.3% Not responsible for grandchildren