Races in Winthrop Town, Massachusetts (MA) Detailed Stats
Data:
Races - White alone (%)
Races - White alone (% change since 2000)
Races - Black alone (%)
Races - Black alone (% change since 2000)
Races - American Indian alone (%)
Races - American Indian alone (% change since 2000)
Races - Asian alone (%)
Races - Asian alone (% change since 2000)
Races - Hispanic (%)
Races - Hispanic (% change since 2000)
Races - Native Hawaiian and Other Pacific Islander alone (%)
Races - Native Hawaiian and Other Pacific Islander alone (% change since 2000)
Races - Two or more races(%)
Races - Two or more races(% change since 2000)
Races - Other race alone (%)
Races - Other race alone (% change since 2000)
Racial diversity
Place of birth - Born in state of residence (%)
Place of birth - Born in state of residence (%) - White
Place of birth - Born in state of residence (%) - Black or African American
Place of birth - Born in state of residence (%) - Asian
Place of birth - Born in state of residence (%) - Hispanic or Latino
Place of birth - Born in state of residence (%) - American Indian and Alaska Native
Place of birth - Born in state of residence (%) - Multirace
Place of birth - Born in state of residence (%) - Other Race
Place of birth - Born in other state (%)
Place of birth - Born in other state (%) - White
Place of birth - Born in other state (%) - Black or African American
Place of birth - Born in other state (%) - Asian
Place of birth - Born in other state (%) - Hispanic or Latino
Place of birth - Born in other state (%) - American Indian and Alaska Native
Place of birth - Born in other state (%) - Multirace
Place of birth - Born in other state (%) - Other Race
Place of birth - Native, outside of US (%)
Place of birth - Native, outside of US (%) - White
Place of birth - Native, outside of US (%) - Black or African American
Place of birth - Native, outside of US (%) - Asian
Place of birth - Native, outside of US (%) - Hispanic or Latino
Place of birth - Native, outside of US (%) - American Indian and Alaska Native
Place of birth - Native, outside of US (%) - Multirace
Place of birth - Native, outside of US (%) - Other Race
Place of birth - Foreign born (%)
Place of birth - Foreign born (%) - White
Place of birth - Foreign born (%) - Black or African American
Place of birth - Foreign born (%) - Asian
Place of birth - Foreign born (%) - Hispanic or Latino
Place of birth - Foreign born (%) - American Indian and Alaska Native
Place of birth - Foreign born (%) - Multirace
Place of birth - Foreign born (%) - Other Race
Residents speaking English at home (%)
Residents speaking English at home - Born in the United States (%)
Residents speaking English at home - Native, born elsewhere (%)
Residents speaking English at home - Foreign born (%)
Residents speaking Spanish at home (%)
Residents speaking Spanish at home - Born in the United States (%)
Residents speaking Spanish at home - Native, born elsewhere (%)
Residents speaking Spanish at home - Foreign born (%)
Residents speaking other language at home (%)
Residents speaking other language at home - Born in the United States (%)
Residents speaking other language at home - Native, born elsewhere (%)
Residents speaking other language at home - Foreign born (%)
Marital status - Never married (%)
Marital status - Now married (%)
Marital status - Separated (%)
Marital status - Widowed (%)
Marital status - Divorced (%)
Ancestries Reported - Arab (%)
Ancestries Reported - Czech (%)
Ancestries Reported - Danish (%)
Ancestries Reported - Dutch (%)
Ancestries Reported - English (%)
Ancestries Reported - French (%)
Ancestries Reported - French Canadian (%)
Ancestries Reported - German (%)
Ancestries Reported - Greek (%)
Ancestries Reported - Hungarian (%)
Ancestries Reported - Irish (%)
Ancestries Reported - Italian (%)
Ancestries Reported - Lithuanian (%)
Ancestries Reported - Norwegian (%)
Ancestries Reported - Polish (%)
Ancestries Reported - Portuguese (%)
Ancestries Reported - Russian (%)
Ancestries Reported - Scotch-Irish (%)
Ancestries Reported - Scottish (%)
Ancestries Reported - Slovak (%)
Ancestries Reported - Subsaharan African (%)
Ancestries Reported - Swedish (%)
Ancestries Reported - Swiss (%)
Ancestries Reported - Ukrainian (%)
Ancestries Reported - United States (%)
Ancestries Reported - Welsh (%)
Ancestries Reported - West Indian (%)
Ancestries Reported - Other (%)
Geographical mobility - Same house 1 year ago (%)
Geographical mobility - Same house 1 year ago (%) - White
Geographical mobility - Same house 1 year ago (%) - Black or African American
Geographical mobility - Same house 1 year ago (%) - Asian
Geographical mobility - Same house 1 year ago (%) - Hispanic or Latino
Geographical mobility - Same house 1 year ago (%) - American Indian and Alaska Native
Geographical mobility - Same house 1 year ago (%) - Multirace
Geographical mobility - Same house 1 year ago (%) - Other Race
Geographical mobility - Moved within same county (%)
Geographical mobility - Moved within same county (%) - White
Geographical mobility - Moved within same county (%) - Black or African American
Geographical mobility - Moved within same county (%) - Asian
Geographical mobility - Moved within same county (%) - Hispanic or Latino
Geographical mobility - Moved within same county (%) - American Indian and Alaska Native
Geographical mobility - Moved within same county (%) - Multirace
Geographical mobility - Moved within same county (%) - Other Race
Geographical mobility - Moved from different county within same state (%)
Geographical mobility - Moved from different county within same state (%) - White
Geographical mobility - Moved from different county within same state (%) - Black or African American
Geographical mobility - Moved from different county within same state (%) - Asian
Geographical mobility - Moved from different county within same state (%) - Hispanic or Latino
Geographical mobility - Moved from different county within same state (%) - American Indian and Alaska Native
Geographical mobility - Moved from different county within same state (%) - Multirace
Geographical mobility - Moved from different county within same state (%) - Other Race
Geographical mobility - Moved from different state (%)
Geographical mobility - Moved from different state (%) - White
Geographical mobility - Moved from different state (%) - Black or African American
Geographical mobility - Moved from different state (%) - Asian
Geographical mobility - Moved from different state (%) - Hispanic or Latino
Geographical mobility - Moved from different state (%) - American Indian and Alaska Native
Geographical mobility - Moved from different state (%) - Multirace
Geographical mobility - Moved from different state (%) - Other Race
Geographical mobility - Moved from abroad (%)
Geographical mobility - Moved from abroad (%) - White
Geographical mobility - Moved from abroad (%) - Black or African American
Geographical mobility - Moved from abroad (%) - Asian
Geographical mobility - Moved from abroad (%) - Hispanic or Latino
Geographical mobility - Moved from abroad (%) - American Indian and Alaska Native
Geographical mobility - Moved from abroad (%) - Multirace
Geographical mobility - Moved from abroad (%) - Other Race
Place of birth for the foreign-born population - Ireland (%)
Place of birth for the foreign-born population - Denmark (%)
Place of birth for the foreign-born population - Norway (%)
Place of birth for the foreign-born population - Sweden (%)
Place of birth for the foreign-born population - United Kingdom (%)
Place of birth for the foreign-born population - England (%)
Place of birth for the foreign-born population - Scotland (%)
Place of birth for the foreign-born population - Other Northern Europe (%)
Place of birth for the foreign-born population - Austria (%)
Place of birth for the foreign-born population - Belgium (%)
Place of birth for the foreign-born population - France (%)
Place of birth for the foreign-born population - Germany (%)
Place of birth for the foreign-born population - Netherlands (%)
Place of birth for the foreign-born population - Switzerland (%)
Place of birth for the foreign-born population - Other Western Europe (%)
Place of birth for the foreign-born population - Greece (%)
Place of birth for the foreign-born population - Italy (%)
Place of birth for the foreign-born population - Portugal (%)
Place of birth for the foreign-born population - Spain (%)
Place of birth for the foreign-born population - Other Southern Europe (%)
Place of birth for the foreign-born population - Albania (%)
Place of birth for the foreign-born population - Belarus (%)
Place of birth for the foreign-born population - Bosnia and Herzegovina (%)
Place of birth for the foreign-born population - Bulgaria (%)
Place of birth for the foreign-born population - Croatia (%)
Place of birth for the foreign-born population - Czechoslovakia (%)
Place of birth for the foreign-born population - Hungary (%)
Place of birth for the foreign-born population - Latvia (%)
Place of birth for the foreign-born population - Lithuania (%)
Place of birth for the foreign-born population - North Macedonia (Macedonia) (%)
Place of birth for the foreign-born population - Moldova (%)
Place of birth for the foreign-born population - Poland (%)
Place of birth for the foreign-born population - Romania (%)
Place of birth for the foreign-born population - Russia (%)
Place of birth for the foreign-born population - Serbia (%)
Place of birth for the foreign-born population - Ukraine (%)
Place of birth for the foreign-born population - Other Eastern Europe (%)
Place of birth for the foreign-born population - China (%)
Place of birth for the foreign-born population - Hong Kong (%)
Place of birth for the foreign-born population - Taiwan (%)
Place of birth for the foreign-born population - Japan (%)
Place of birth for the foreign-born population - Korea (%)
Place of birth for the foreign-born population - Other Eastern Asia (%)
Place of birth for the foreign-born population - Afghanistan (%)
Place of birth for the foreign-born population - Bangladesh (%)
Place of birth for the foreign-born population - India (%)
Place of birth for the foreign-born population - Iran (%)
Place of birth for the foreign-born population - Kazakhstan (%)
Place of birth for the foreign-born population - Nepal (%)
Place of birth for the foreign-born population - Pakistan (%)
Place of birth for the foreign-born population - Sri Lanka (%)
Place of birth for the foreign-born population - Uzbekistan (%)
Place of birth for the foreign-born population - Other South Central Asia (%)
Place of birth for the foreign-born population - Burma (%)
Place of birth for the foreign-born population - Cambodia (%)
Place of birth for the foreign-born population - Indonesia (%)
Place of birth for the foreign-born population - Laos (%)
Place of birth for the foreign-born population - Malaysia (%)
Place of birth for the foreign-born population - Philippines (%)
Place of birth for the foreign-born population - Singapore (%)
Place of birth for the foreign-born population - Thailand (%)
Place of birth for the foreign-born population - Vietnam (%)
Place of birth for the foreign-born population - Other South Eastern Asia (%)
Place of birth for the foreign-born population - Armenia (%)
Place of birth for the foreign-born population - Iraq (%)
Place of birth for the foreign-born population - Israel (%)
Place of birth for the foreign-born population - Jordan (%)
Place of birth for the foreign-born population - Kuwait (%)
Place of birth for the foreign-born population - Lebanon (%)
Place of birth for the foreign-born population - Saudi Arabia (%)
Place of birth for the foreign-born population - Syria (%)
Place of birth for the foreign-born population - Turkey (%)
Place of birth for the foreign-born population - Yemen (%)
Place of birth for the foreign-born population - Other Western Asia (%)
Place of birth for the foreign-born population - Eritrea (%)
Place of birth for the foreign-born population - Ethiopia (%)
Place of birth for the foreign-born population - Kenya (%)
Place of birth for the foreign-born population - Somalia (%)
Place of birth for the foreign-born population - Uganda (%)
Place of birth for the foreign-born population - Zimbabwe (%)
Place of birth for the foreign-born population - Other Eastern Africa (%)
Place of birth for the foreign-born population - Cameroon (%)
Place of birth for the foreign-born population - Congo (%)
Place of birth for the foreign-born population - Democratic Republic of Congo (Zaire) (%)
Place of birth for the foreign-born population - Other Middle Africa (%)
Place of birth for the foreign-born population - Egypt (%)
Place of birth for the foreign-born population - Morocco (%)
Place of birth for the foreign-born population - Sudan (%)
Place of birth for the foreign-born population - Other Northern Africa (%)
Place of birth for the foreign-born population - South Africa (%)
Place of birth for the foreign-born population - Other Southern Africa (%)
Place of birth for the foreign-born population - Cabo Verde (%)
Place of birth for the foreign-born population - Ghana (%)
Place of birth for the foreign-born population - Liberia (%)
Place of birth for the foreign-born population - Nigeria (%)
Place of birth for the foreign-born population - Senegal (%)
Place of birth for the foreign-born population - Sierra Leone (%)
Place of birth for the foreign-born population - Other Western Africa (%)
Place of birth for the foreign-born population - Australia (%)
Place of birth for the foreign-born population - New Zealand (%)
Place of birth for the foreign-born population - Fiji (%)
Place of birth for the foreign-born population - Micronesia (%)
Place of birth for the foreign-born population - Bahamas (%)
Place of birth for the foreign-born population - Barbados (%)
Place of birth for the foreign-born population - Cuba (%)
Place of birth for the foreign-born population - Dominica (%)
Place of birth for the foreign-born population - Dominican Republic (%)
Place of birth for the foreign-born population - Grenada (%)
Place of birth for the foreign-born population - Haiti (%)
Place of birth for the foreign-born population - Jamaica (%)
Place of birth for the foreign-born population - St. Vincent and the Grenadines (%)
Place of birth for the foreign-born population - Trinidad and Tobago (%)
Place of birth for the foreign-born population - West Indies (%)
Place of birth for the foreign-born population - Other Caribbean (%)
Place of birth for the foreign-born population - Belize (%)
Place of birth for the foreign-born population - Costa Rica (%)
Place of birth for the foreign-born population - El Salvador (%)
Place of birth for the foreign-born population - Guatemala (%)
Place of birth for the foreign-born population - Honduras (%)
Place of birth for the foreign-born population - Mexico (%)
Place of birth for the foreign-born population - Nicaragua (%)
Place of birth for the foreign-born population - Panama (%)
Place of birth for the foreign-born population - Other Central America (%)
Place of birth for the foreign-born population - Argentina (%)
Place of birth for the foreign-born population - Bolivia (%)
Place of birth for the foreign-born population - Brazil (%)
Place of birth for the foreign-born population - Chile (%)
Place of birth for the foreign-born population - Colombia (%)
Place of birth for the foreign-born population - Ecuador (%)
Place of birth for the foreign-born population - Guyana (%)
Place of birth for the foreign-born population - Peru (%)
Place of birth for the foreign-born population - Uruguay (%)
Place of birth for the foreign-born population - Venezuela (%)
Place of birth for the foreign-born population - Other South America (%)
Place of birth for the foreign-born population - Canada (%)
Place of birth for the foreign-born population - Other Northern America (%)
Place of birth for the foreign-born population - Other (%)
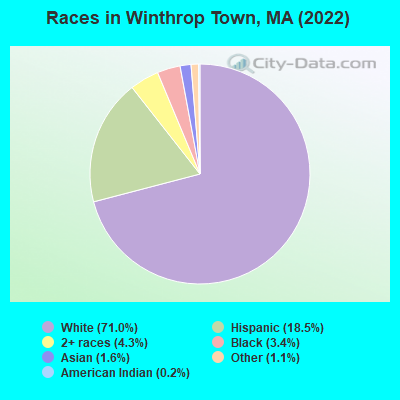
According to 2022 data, the most numerous races in Winthrop Town, MA are White alone (13,182 residents), Hispanic (3,439 residents), and Asian alone (300 residents). 72.0% of Winthrop Town residents speak English at home.
Race distribution in Winthrop Town 13,182 71.0% White alone 3,439 18.5% Hispanic 795 4.3% Two or more races 629 3.4% Black alone 300 1.6% Asian alone 211 1.1% Other race alone 38 0.2% American Indian alone
2000 2022
5,198,359 81.9% White alone 428,729 6.8% Hispanic 318,329 5.0% Black alone 236,786 3.7% Asian alone 110,338 1.7% Two or more races 43,586 0.7% Other race alone 11,264 0.2% American Indian alone 1,706 0.03% Native Hawaiian and Other
4,676,627 67.0% White alone 911,038 13.0% Hispanic 501,463 7.2% Asian alone 459,740 6.6% Black alone 341,889 4.9% Two or more races 84,403 1.2% Other race alone 5,838 0.08% American Indian alone 976 0.01% Native Hawaiian and Other
Income and house value in Winthrop Town Median household income in 2022 $88,730 White non-Hispanic householders$192,358 Asian householders$97,888 Some other race householders$123,159 Two or more races householders$107,218 Hispanic or Latino race householders
Median age by race in Winthrop Town
49.1 Median age for White residents48.4 49.5 43.8 Median age for Black or African American residents51.8 20.1 42.5 Median age for American Indian / Alaska Native residents49.9 39.0 37.2 Median age for Asian residents35.7 40.6 -514,227,641.8 Median age for Native Hawaiian / Pacific Islander residents-513,131,312.6 -508,717,948.2 31.1 Median age for Other race residents28.1 37.4 41.3 Median age for Two or more races residents43.1 41.8 50.6 Median age for White alone residents50.9 50.3 35.3 Median age for Hispanic or Latino residents32.3 36.7
Owner/renter occupied households by race in Winthrop Town
House owners and renters - White residents 3,968 58.2% Owner occupied2,853 41.8% Renter occupiedHouse owners and renters - Black or African American residents 86 30.6% Owner occupied195 69.4% Renter occupiedHouse owners and renters - American Indian / Alaska Native residents 107 100.0% Owner occupiedHouse owners and renters - Asian residents 81 91.2% Owner occupied8 8.8% Renter occupiedHouse owners and renters - Other race residents 97 23.6% Owner occupied315 76.4% Renter occupiedHouse owners and renters - Two or more races residents 560 70.0% Owner occupied240 30.0% Renter occupiedHouse owners and renters - White alone residents 4,058 60.7% Owner occupied2,622 39.3% Renter occupiedHouse owners and renters - Hispanic or Latino residents 494 36.1% Owner occupied872 63.9% Renter occupied
Language usage in Winthrop Town
English speakers - Total 72.0% of residents of Winthrop Town speak English at home.
16.3% of residents speak Spanish at home 2,088 72.4% Speak English very well797 27.6% Speak English less than very well12.4% of residents speak other language at home 1,753 79.8% Speak English very well444 20.2% Speak English less than very well
English speakers - Born in the United States 83.9% of residents of Winthrop Town speak English at home.
11.3% of residents speak Spanish at home 362 100.0% Speak English very well5.0% of residents speak other language at home 157 98.7% Speak English very well2 1.3% Speak English less than very well
English speakers - Native, born elsewhere 44.7% of residents of Winthrop Town speak English at home.
51.8% of residents speak Spanish at home 161 100.0% Speak English very well
English speakers - Foreign-born 14.0% of residents of Winthrop Town speak English at home.
44.8% of residents speak Spanish at home 727 47.3% Speak English very well810 52.7% Speak English less than very well42.4% of residents speak other language at home 1,062 73.0% Speak English very well392 27.0% Speak English less than very well
White (Caucasian) - Speak only English Native:
94.4% (10,884)Foreign-born:
20.0% (298)
White (Caucasian) - Speak another language Native:
6.0% (694)Foreign-born:
79.2% (1,182)
Black or African American - Speak only English Native:
60.6% (322)Foreign-born:
38.7% (60)
Black or African American - Speak another language Native:
35.8% (190)Foreign-born:
59.1% (92)
American Indian / Alaska Native - Speak another language Native:
41.9% (90)Foreign-born:
91.9% (448)
Asian - Speak only English Native:
38.8% (25)Foreign-born:
11.7% (21)
Asian - Speak another language Native:
60.9% (39)Foreign-born:
87.0% (155)
Other race - Speak only English Native:
60.8% (380)Foreign-born:
0.9% (4)
Other race - Speak another language Native:
44.7% (280)Foreign-born:
100.0% (503)
Two or more races - Speak only English Native:
42.3% (498)Foreign-born:
6.3% (33)
Two or more races - Speak another language Native:
58.3% (687)Foreign-born:
93.2% (485)
White alone - Speak only English Native:
96.5% (10,815)Foreign-born:
21.0% (310)
White alone - Speak another language Native:
3.8% (424)Foreign-born:
79.8% (1,175)
Hispanic or Latino - Speak only English Native:
26.0% (465)Foreign-born:
0.3% (4)
Hispanic or Latino - Speak another language Native:
73.7% (1,317)Foreign-born:
100.0% (1,522)
Foreign-born residents in Winthrop Town
Marital status for residents in Winthrop Town Marital status - White (Caucasian) population 15 years and over
Males 36.6% Never married47.7% Now married1.2% Separated3.3% Widowed11.3% DivorcedFemales 33.0% Never married38.2% Now married1.0% Separated9.4% Widowed18.4% DivorcedWomen who gave birth in the past 12 months Now married:
100.0% (113)Unmarried:
0.0% (0)
Women who did not give birth in the past 12 months Now married:
34.0% (1,007)Unmarried:
66.0% (1,954)
Marital status - Black or African American population 15 years and over
Males 58.7% Never married17.6% Now married1.7% Separated0.0% Widowed22.0% DivorcedFemales 42.1% Never married9.8% Now married0.0% Separated0.0% Widowed48.1% DivorcedWomen who did not give birth in the past 12 months Now married:
10.2% (19)Unmarried:
89.8% (168)
Marital status - American Indian / Alaska Native population 15 years and over
Males 44.9% Never married29.3% Now married0.0% Separated0.0% Widowed25.9% DivorcedFemales 1.5% Never married30.1% Now married32.4% Separated0.0% Widowed36.0% DivorcedWomen who did not give birth in the past 12 months Now married:
97.6% (98)Unmarried:
2.4% (2)
Marital status - Asian population 15 years and over
Males 7.1% Never married89.3% Now married0.0% Separated0.0% Widowed3.6% DivorcedFemales 5.3% Never married86.0% Now married0.0% Separated0.0% Widowed8.8% DivorcedWomen who did not give birth in the past 12 months Now married:
93.3% (81)Unmarried:
6.7% (6)
Marital status - Other race population 15 years and over
Males 53.6% Never married37.1% Now married5.7% Separated0.0% Widowed3.6% DivorcedFemales 42.2% Never married35.7% Now married0.0% Separated17.7% Widowed4.5% DivorcedWomen who gave birth in the past 12 months Now married:
0.0% (0)Unmarried:
100.0% (12)
Women who did not give birth in the past 12 months Now married:
24.9% (79)Unmarried:
75.1% (238)
Marital status - Two or more races population 15 years and over
Males 45.9% Never married44.3% Now married0.0% Separated1.6% Widowed8.3% DivorcedFemales 25.4% Never married48.1% Now married0.0% Separated20.7% Widowed5.8% DivorcedWomen who gave birth in the past 12 months Now married:
100.0% (8)Unmarried:
0.0% (0)
Women who did not give birth in the past 12 months Now married:
43.1% (176)Unmarried:
56.9% (232)
Marital status - White alone, not Hispanic / Latino population 15 years and over
Males 32.0% Never married51.7% Now married1.2% Separated3.6% Widowed11.5% DivorcedFemales 31.7% Never married39.0% Now married1.1% Separated9.9% Widowed18.2% DivorcedWomen who gave birth in the past 12 months Now married:
100.0% (120)Unmarried:
0.0% (0)
Women who did not give birth in the past 12 months Now married:
34.9% (993)Unmarried:
65.1% (1,853)
Marital status - Hispanic or Latino population 15 years and over
Males 60.6% Never married28.6% Now married2.5% Separated0.0% Widowed8.3% DivorcedFemales 34.2% Never married36.1% Now married3.3% Separated15.1% Widowed11.3% DivorcedWomen who gave birth in the past 12 months Now married:
38.9% (7)Unmarried:
61.1% (11)
Women who did not give birth in the past 12 months Now married:
38.6% (331)Unmarried:
61.4% (527)
Ancestries in Winthrop Town
1,959 21.3% Italian1,415 15.4% Irish627 6.8% Albanian470 5.1% American297 3.2% English293 3.2% Moroccan184 2.0% Polish154 1.7% Greek143 1.6% German103 1.1% Swiss92 1.0% Russian84 0.9% Maltese74 0.8% Brazilian57 0.6% French Canadian56 0.6% French52 0.6% Lithuanian51 0.6% Lebanese46 0.5% Scottish41 0.4% European34 0.4% Bulgarian34 0.4% Nigerian34 0.4% African29 0.3% Eastern European28 0.3% Swedish21 0.2% Guyanese19 0.2% Hungarian17 0.2% British16 0.2% Syrian15 0.2% Canadian13 0.1% Serbian11 0.1% Haitian10 0.1% Norwegian9 0.10% Portuguese8 0.09% Austrian6 0.07% Welsh
Geographical mobility in Winthrop Town Same house 1 year ago 11,429 85.3% White (Caucasian)628 91.7% Black or African American671 100.0% American Indian / Alaska Native280 93.5% Asian964 81.7% Other race1,310 69.6% Two or more races11,446 87.5% White alone, not Hispanic / Latino2,449 72.1% Hispanic or LatinoMoved within same county 1,061 7.9% White / Caucasian14 2.1% Black or African American42 3.6% Other race477 25.3% Two or more races955 7.3% White alone, not Hispanic / Latino464 13.7% Hispanic or LatinoMoved within same state 274 2.0% White / Caucasian6 0.9% Black or African American11 3.7% Asian124 10.5% Other race13 0.7% Two or more races165 1.3% White alone, not Hispanic / Latino261 7.7% Hispanic or LatinoMoved from different state 399 3.0% White / Caucasian25 3.6% Black or African American82 7.0% Other race15 0.8% Two or more races311 2.4% White alone, not Hispanic / Latino197 5.8% Hispanic or LatinoMoved from abroad 19 0.1% White19 0.1% White alone, not Hispanic / Latino
Children Nativity (place of birth) in Winthrop Town
Children under 6 years - Living with two parents Both parents native 546 99.8% Native1 0.2% Foreign-bornBoth parents foreign-born 223 95.8% Native10 4.2% Foreign-bornChildren under 6 years - Living with one parent Native parent 190 100.0% NativeForeign-born parent 9 100.0% NativeChildren 6 to 17 years - Living with two parents Both parents native 877 100.0% NativeBoth parents foreign-born 220 72.4% Native84 27.6% Foreign-bornOne native, one foreign-born parent 153 100.0% NativeChildren 6 to 17 years - Living with one parent Native parent 565 100.0% NativeForeign-born parent 244 59.7% Native165 40.3% Foreign-born
Grandparents responsible for own grandchildren in Winthrop Town
Grandparents (30 to 59 years) White / Caucasian 19 100.0% Responsible for grandchildrenWhite alone, not Hispanic / Latino 19 100.0% Responsible for grandchildrenGrandparents (60 years and over) White / Caucasian 25 20.1% Responsible for grandchildren98 79.9% Not responsible for grandchildrenWhite alone, not Hispanic / Latino 27 36.3% Responsible for grandchildren48 63.7% Not responsible for grandchildren