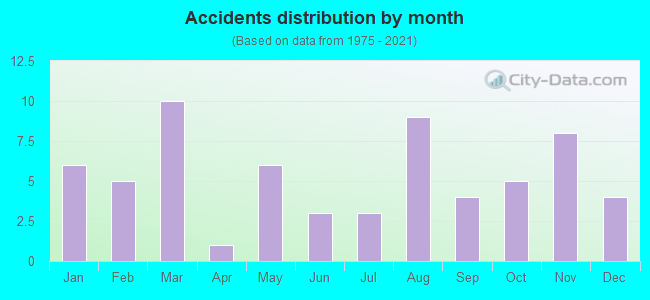
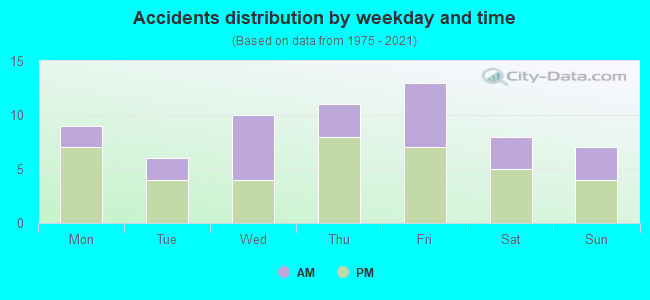
Fatal car crashes and road traffic accidents in Shoreline, Washington
- Fatal car crash and road traffic accident statistics for 2021
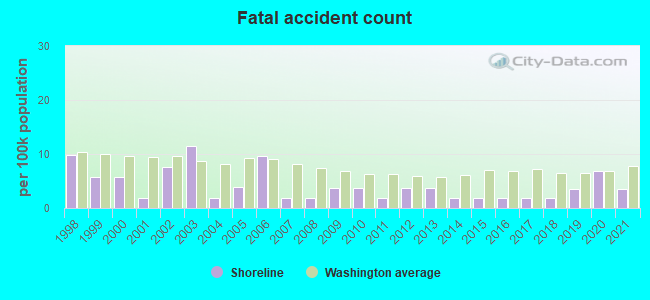
- Fatal accident count2
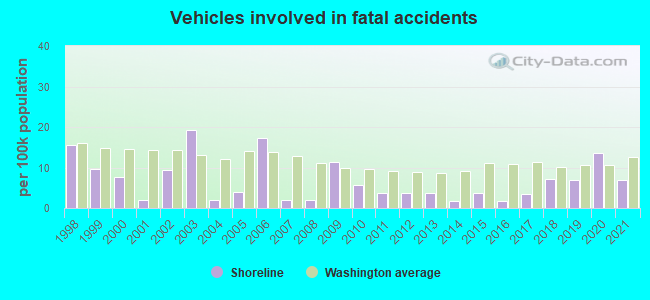
- Vehicles involved in fatal accidents4
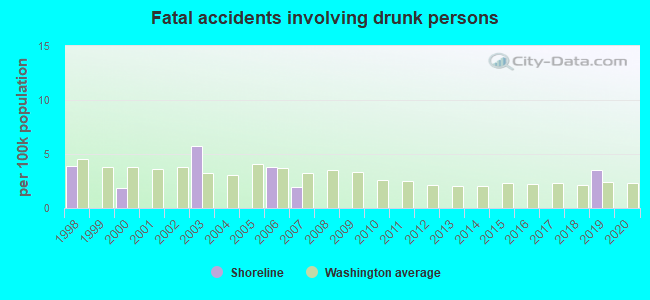
- Fatal accidents involving drunk persons0
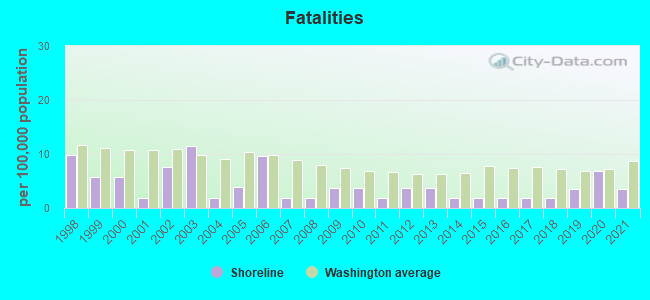
- Fatalities2
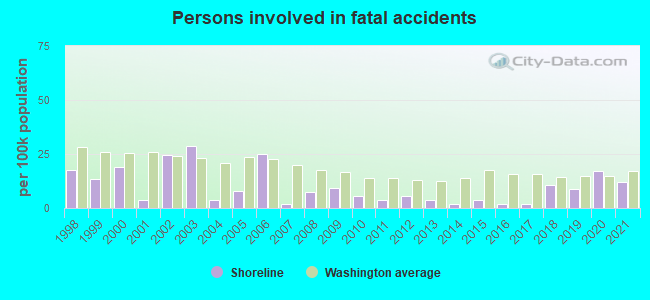
- Persons involved in fatal accidents7
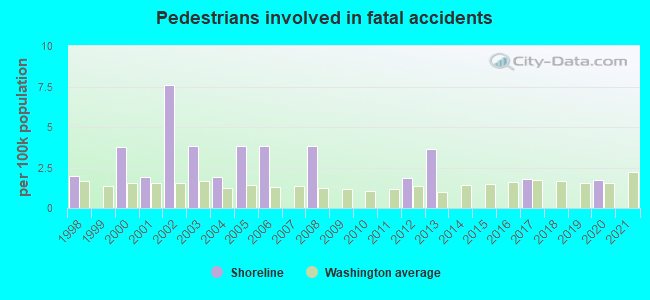
- Pedestrians involved in fatal accidents0
- Fatal car crash and road traffic accident statistics for 2020
- Fatal accident count4
- Vehicles involved in fatal accidents8
- Fatal accidents involving drunk persons0
- Fatalities4
- Persons involved in fatal accidents10
- Pedestrians involved in fatal accidents1
- Fatal car crash and road traffic accident statistics for 2019
- Fatal accident count2
- Vehicles involved in fatal accidents4
- Fatal accidents involving drunk persons2
- Fatalities2
- Persons involved in fatal accidents5
- Pedestrians involved in fatal accidents0
- Fatal car crash and road traffic accident statistics for 2018
- Fatal accident count1
- Vehicles involved in fatal accidents4
- Fatal accidents involving drunk persons0
- Fatalities1
- Persons involved in fatal accidents6
- Pedestrians involved in fatal accidents0

Data:
No street view available for this location
Shoreline fatal accident statistics for 1998 - 2021
Average EMS response time
- Shoreline(Based on 46 reports) 4.5 mins
- King County(Based on 3,619 reports) 5.6 mins
- Washington(Based on 17,122 reports) 8.2 mins
Average hospital transport time
- Shoreline(Based on 34 reports) 45.7 mins
- King County(Based on 1,630 reports) 52.1 mins
- Washington(Based on 8,762 reports) 49.2 mins
Daylight
- Shoreline(Based on 63 reports) 47.6%
- King County(Based on 5,652 reports) 41.0%
- Washington(Based on 27,943 reports) 45.6%
Dark - Lighted
- Shoreline(Based on 63 reports) 38.1%
- King County(Based on 5,652 reports) 34.4%
- Washington(Based on 27,943 reports) 18.4%
Dark - Not Lighted
- Shoreline(Based on 63 reports) 11.1%
- King County(Based on 5,652 reports) 20.6%
- Washington(Based on 27,943 reports) 31.6%
Dusk
- Shoreline(Based on 63 reports) 1.6%
- King County(Based on 5,652 reports) 1.9%
- Washington(Based on 27,943 reports) 2.1%
Dawn
- Shoreline(Based on 63 reports) 1.6%
- King County(Based on 5,652 reports) 1.3%
- Washington(Based on 27,943 reports) 1.5%
Clear
- Shoreline(Based on 64 reports) 73.4%
- King County(Based on 5,648 reports) 76.4%
- Washington(Based on 27,933 reports) 80.2%
Rain
- Shoreline(Based on 64 reports) 15.6%
- King County(Based on 5,648 reports) 16.4%
- Washington(Based on 27,933 reports) 12.1%
Unknown
- Shoreline(Based on 64 reports) 9.4%
- King County(Based on 5,648 reports) 4.2%
- Washington(Based on 27,933 reports) 3.2%
Fog, Smog, Smoke
- Shoreline(Based on 64 reports) 1.6%
- King County(Based on 5,648 reports) 1.3%
- Washington(Based on 27,933 reports) 1.9%

Shoreline fatal car crash and road traffic accident list for 2021
| # | Date | Location | Vehicles | Drunk persons | Fatalites | Persons | Pedestrians |
|---|
| 1 | Mar 30, 2021 02:13 AM | I-5 | 1 | - | 1
| 1 | - |
| 2 | Nov 16, 2021 06:04 PM | Linden Ave N, N 185th St | 3 | - | 1
| 6 | - |
Shoreline fatal car crash and road traffic accident list for 2020
- Fatal accident count4
- Vehicles involved in fatal accidents8
- Fatalities4
- Persons involved in fatal accidents10
- Pedestrians involved in fatal accidents1
Daylight
- Shoreline(Based on 4 reports) 75.0%
- King County(Based on 102 reports) 41.2%
- Washington(Based on 522 reports) 46.4%
Dark - Lighted
- Shoreline(Based on 4 reports) 25.0%
- King County(Based on 102 reports) 44.1%
- Washington(Based on 522 reports) 22.4%
Clear
- Shoreline(Based on 4 reports) 75.0%
- King County(Based on 101 reports) 61.4%
- Washington(Based on 524 reports) 69.1%
Unknown
- Shoreline(Based on 4 reports) 25.0%
- King County(Based on 101 reports) 23.8%
- Washington(Based on 524 reports) 14.9%
Shoreline fatal car crash and road traffic accident list for 2019
Shoreline fatal car crash and road traffic accident list for 2018
| # | Date | Location | Vehicles | Drunk persons | Fatalites | Persons | Pedestrians |
|---|
| 1 | Sep 13, 2018 07:04 AM | Sr-99, N 155th St | 4 | - | 1
| 6 | - |
Shoreline fatal car crash and road traffic accident list for 2017
| # | Date | Location | Vehicles | Drunk persons | Fatalites | Persons | Pedestrians |
|---|
| 1 | Nov 5, 2017 03:10 AM | I-5 | 2 | - | 1
| 1 | 1 |
Shoreline fatal car crash and road traffic accident list for 2016
| # | Date | Location | Vehicles | Drunk persons | Fatalites | Persons | Pedestrians |
|---|
| 1 | Dec 6, 2016 08:20 AM | 1st Ave Ne | 1 | - | 1
| 1 | - |
Shoreline fatal car crash and road traffic accident list for 2015
| # | Date | Location | Vehicles | Drunk persons | Fatalites | Persons | Pedestrians |
|---|
| 1 | Sep 16, 2015 01:26 PM | N 205th St | 2 | - | 1
| 2 | - |
Shoreline fatal car crash and road traffic accident list for 2014
| # | Date | Location | Vehicles | Drunk persons | Fatalites | Persons | Pedestrians |
|---|
| 1 | Feb 25, 2014 08:52 PM | Ne 185th St | 1 | - | 1
| 1 | - |
Shoreline fatal car crash and road traffic accident list for 2013
Shoreline fatal car crash and road traffic accident list for 2012
Shoreline fatal car crash and road traffic accident list for 2011
Shoreline fatal car crash and road traffic accident list for 2010
Shoreline fatal car crash and road traffic accident list for 2009
| # | Date | Location | Vehicles | Drunk persons | Fatalites | Persons | Pedestrians |
|---|
| 1 | Jul 27, 2009 06:38 AM | N 175th St, Sr-99 | 4 | - | 1
| 3 | - |
| 2 | Jan 21, 2009 05:57 PM | N 145th St | 2 | - | 1
| 2 | - |
Shoreline fatal car crash and road traffic accident list for 2008
| # | Date | Location | Vehicles | Drunk persons | Fatalites | Persons | Pedestrians |
|---|
| 1 | Feb 6, 2008 11:18 AM | Sr-523, 15th Ave Ne | 1 | - | 1
| 4 | 2 |
Shoreline fatal car crash and road traffic accident list for 2007
| # | Date | Location | Vehicles | Drunk persons | Fatalites | Persons | Pedestrians |
|---|
| 1 | May 8, 2007 02:52 AM | I-5 | 1 | 1
| 1 | 1 | - |
Shoreline fatal car crash and road traffic accident list for 2006
- Fatal accident count5
- Vehicles involved in fatal accidents9
- Fatal accidents involving drunk persons2
- Fatalities5
- Persons involved in fatal accidents13
- Pedestrians involved in fatal accidents2
Average EMS response time
- Shoreline(Based on 4 reports) 5.8 mins
- King County(Based on 96 reports) 5.8 mins
- Washington(Based on 445 reports) 8.3 mins
Average hospital transport time
- Shoreline(Based on 3 reports) 76.3 mins
- King County(Based on 62 reports) 55.5 mins
- Washington(Based on 266 reports) 54.9 mins
Daylight
- Shoreline(Based on 5 reports) 60.0%
- King County(Based on 120 reports) 42.5%
- Washington(Based on 573 reports) 49.2%
Dark - Lighted
- Shoreline(Based on 5 reports) 40.0%
- King County(Based on 120 reports) 30.8%
- Washington(Based on 573 reports) 18.0%
Clear
- Shoreline(Based on 5 reports) 60.0%
- King County(Based on 120 reports) 82.5%
- Washington(Based on 578 reports) 86.5%
Rain
- Shoreline(Based on 5 reports) 40.0%
- King County(Based on 120 reports) 13.3%
- Washington(Based on 578 reports) 10.0%
Shoreline fatal car crash and road traffic accident list for 2005
| # | Date | Location | Vehicles | Drunk persons | Fatalites | Persons | Pedestrians |
|---|
| 1 | Feb 1, 2005 01:00 PM | Sr-99, 183 | 1 | - | 1
| 2 | 1 |
| 2 | Jun 15, 2005 02:21 PM | Sr-99 | 1 | - | 1
| 2 | 1 |
Shoreline fatal car crash and road traffic accident list for 2004
| # | Date | Location | Vehicles | Drunk persons | Fatalites | Persons | Pedestrians |
|---|
| 1 | Jan 22, 2004 11:20 AM | N 145th St, Phinney Ave N | 1 | - | 1
| 2 | 1 |
Shoreline fatal car crash and road traffic accident list for 2003
- Fatal accident count6
- Vehicles involved in fatal accidents10
- Fatal accidents involving drunk persons3
- Fatalities6
- Persons involved in fatal accidents15
- Pedestrians involved in fatal accidents2
Average EMS response time
- Shoreline(Based on 6 reports) 4.2 mins
- King County(Based on 93 reports) 5.9 mins
- Washington(Based on 446 reports) 9.3 mins
Average hospital transport time
- Shoreline(Based on 5 reports) 39.6 mins
- King County(Based on 78 reports) 46.7 mins
- Washington(Based on 327 reports) 52.5 mins
Dark - Lighted
- Shoreline(Based on 6 reports) 50.0%
- King County(Based on 97 reports) 44.3%
- Washington(Based on 532 reports) 18.0%
Daylight
- Shoreline(Based on 6 reports) 50.0%
- King County(Based on 97 reports) 39.2%
- Washington(Based on 532 reports) 49.8%
Clear
- Shoreline(Based on 6 reports) 83.3%
- King County(Based on 98 reports) 85.7%
- Washington(Based on 539 reports) 83.7%
Rain
- Shoreline(Based on 6 reports) 16.7%
- King County(Based on 98 reports) 11.2%
- Washington(Based on 539 reports) 10.9%
| # | Date | Location | Vehicles | Drunk persons | Fatalites | Persons | Pedestrians |
|---|
| 1 | Mar 23, 2003 09:26 AM | N 155th | 1 | - | 1
| 2 | 1 |
| 2 | Apr 17, 2003 08:49 PM | Sr-99 | 3 | 1
| 1 | 3 | - |
| 3 | Aug 1, 2003 11:32 AM | Meridian Ave N | 2 | - | 1
| 3 | - |
| 4 | Aug 16, 2003 02:46 AM | Nw Richmond Beach Rd | 1 | 1
| 1 | 1 | - |
| 5 | Nov 29, 2003 12:09 AM | Westminster Way N | 2 | - | 1
| 4 | - |
| 6 | Nov 17, 2003 07:26 PM | Meridian Ave N | 1 | 1
| 1 | 2 | 1 |
Shoreline fatal car crash and road traffic accident list for 2002
- Fatal accident count4
- Vehicles involved in fatal accidents5
- Fatalities4
- Persons involved in fatal accidents13
- Pedestrians involved in fatal accidents4
Average EMS response time
- Shoreline(Based on 3 reports) 2.7 mins
- King County(Based on 94 reports) 5.7 mins
- Washington(Based on 548 reports) 9.3 mins
Average hospital transport time
- Shoreline(Based on 3 reports) 37.7 mins
- King County(Based on 67 reports) 49.3 mins
- Washington(Based on 415 reports) 54.2 mins
Daylight
- Shoreline(Based on 4 reports) 100.0%
- King County(Based on 96 reports) 43.8%
- Washington(Based on 583 reports) 47.2%
Clear
- Shoreline(Based on 4 reports) 100.0%
- King County(Based on 96 reports) 83.3%
- Washington(Based on 586 reports) 87.0%
| # | Date | Location | Vehicles | Drunk persons | Fatalites | Persons | Pedestrians |
|---|
| 1 | Mar 28, 2002 08:29 AM | 15th Ave Ne | 1 | - | 1
| 3 | 2 |
| 2 | May 23, 2002 08:15 AM | Ne 155th St | 1 | - | 1
| 2 | 1 |
| 3 | Oct 26, 2002 04:57 PM | Sr-99 | 1 | - | 1
| 5 | 1 |
| 4 | Nov 2, 2002 08:03 AM | Medvale Ave N | 2 | - | 1
| 3 | - |
Shoreline fatal car crash and road traffic accident list for 2001
| # | Date | Location | Vehicles | Drunk persons | Fatalites | Persons | Pedestrians |
|---|
| 1 | Jan 9, 2001 06:35 AM | Nwrichmondbeachrd | 1 | - | 1
| 2 | 1 |
Shoreline fatal car crash and road traffic accident list for 2000
| # | Date | Location | Vehicles | Drunk persons | Fatalites | Persons | Pedestrians |
|---|
| 1 | May 16, 2000 03:59 AM | I-5 | 1 | - | 1
| 2 | 1 |
| 2 | Aug 10, 2000 10:37 PM | Sr-99 | 1 | 1
| 1 | 4 | 1 |
| 3 | Dec 17, 2000 06:52 PM | I-5 | 2 | - | 1
| 4 | - |
Shoreline fatal car crash and road traffic accident list for 1999
| # | Date | Location | Vehicles | Drunk persons | Fatalites | Persons | Pedestrians |
|---|
| 1 | Feb 25, 1999 09:20 AM | 15thavene | 2 | - | 1
| 2 | - |
| 2 | Mar 12, 1999 10:08 PM | Sr-104 | 2 | - | 1
| 4 | - |
| 3 | Mar 13, 1999 10:17 AM | Sr-99 | 1 | - | 1
| 1 | - |
Shoreline fatal car crash and road traffic accident list for 1998
- Fatal accident count5
- Vehicles involved in fatal accidents8
- Fatal accidents involving drunk persons2
- Fatalities5
- Persons involved in fatal accidents9
- Pedestrians involved in fatal accidents1
Average EMS response time
- Shoreline(Based on 5 reports) 5.0 mins
- King County(Based on 95 reports) 5.5 mins
- Washington(Based on 522 reports) 8.2 mins
Average hospital transport time
- Shoreline(Based on 4 reports) 38.8 mins
- King County(Based on 54 reports) 52.2 mins
- Washington(Based on 363 reports) 49.4 mins
Daylight
- Shoreline(Based on 5 reports) 40.0%
- King County(Based on 107 reports) 51.4%
- Washington(Based on 590 reports) 50.8%
Dark - Lighted
- Shoreline(Based on 5 reports) 20.0%
- King County(Based on 107 reports) 27.1%
- Washington(Based on 590 reports) 16.9%
Dawn
- Shoreline(Based on 5 reports) 20.0%
- King County(Based on 107 reports) 1.9%
- Washington(Based on 590 reports) 1.2%
Dark - Not Lighted
- Shoreline(Based on 5 reports) 20.0%
- King County(Based on 107 reports) 18.7%
- Washington(Based on 590 reports) 29.3%
Clear
- Shoreline(Based on 5 reports) 80.0%
- King County(Based on 107 reports) 77.6%
- Washington(Based on 590 reports) 81.7%
Rain
- Shoreline(Based on 5 reports) 20.0%
- King County(Based on 107 reports) 19.6%
- Washington(Based on 590 reports) 13.2%
| # | Date | Location | Vehicles | Drunk persons | Fatalites | Persons | Pedestrians |
|---|
| 1 | Jan 16, 1998 11:29 PM | Sr-99 | 1 | 1
| 1 | 2 | 1 |
| 2 | Feb 2, 1998 02:20 PM | Sr-104 | 2 | - | 1
| 2 | - |
| 3 | Mar 6, 1998 08:53 PM | I-5 | 1 | 1
| 1 | 1 | - |
| 4 | Mar 25, 1998 06:15 AM | Ronaldplacen | 2 | - | 1
| 2 | - |
| 5 | Oct 22, 1998 01:54 PM | Nwrichmondbeachrdnw | 2 | - | 1
| 2 | - |
Shoreline fatal car crash and road traffic accident list for 1997
- Fatal accident count4
- Vehicles involved in fatal accidents6
- Fatal accidents involving drunk persons3
- Fatalities4
- Persons involved in fatal accidents12
- Pedestrians involved in fatal accidents4
Average EMS response time
- Shoreline(Based on 4 reports) 4.0 mins
- King County(Based on 103 reports) 5.7 mins
- Washington(Based on 537 reports) 8.3 mins
Average hospital transport time
- Shoreline(Based on 4 reports) 39.8 mins
- King County(Based on 65 reports) 50.7 mins
- Washington(Based on 410 reports) 47.7 mins
Dark - Not Lighted
- Shoreline(Based on 4 reports) 50.0%
- King County(Based on 114 reports) 20.2%
- Washington(Based on 585 reports) 32.6%
Daylight
- Shoreline(Based on 4 reports) 25.0%
- King County(Based on 114 reports) 43.9%
- Washington(Based on 585 reports) 46.7%
Dark - Lighted
- Shoreline(Based on 4 reports) 25.0%
- King County(Based on 114 reports) 32.5%
- Washington(Based on 585 reports) 16.9%
Clear
- Shoreline(Based on 4 reports) 75.0%
- King County(Based on 114 reports) 78.9%
- Washington(Based on 587 reports) 79.6%
Rain
- Shoreline(Based on 4 reports) 25.0%
- King County(Based on 114 reports) 19.3%
- Washington(Based on 587 reports) 15.5%
| # | Date | Location | Vehicles | Drunk persons | Fatalites | Persons | Pedestrians |
|---|
| 1 | Jul 29, 1997 12:46 AM | 15thavene | 1 | - | 1
| 4 | 2 |
| 2 | Aug 22, 1997 11:03 PM | 99 | 2 | 2
| 1 | 4 | 1 |
| 3 | Aug 27, 1997 10:32 PM | 99 | 2 | 1
| 1 | 2 | - |
| 4 | Oct 29, 1997 06:00 PM | 15thavene | 1 | - | 1
| 2 | 1 |
Shoreline fatal car crash and road traffic accident list for 1996
| # | Date | Location | Vehicles | Drunk persons | Fatalites | Persons | Pedestrians |
|---|
| 1 | Jan 7, 1996 05:10 PM | Ne155thst | 2 | - | 1
| 3 | 1 |
| 2 | Mar 31, 1996 08:16 PM | 99 | 2 | - | 1
| 4 | - |
Shoreline fatal car crash and road traffic accident list for 1994
| # | Date | Location | Vehicles | Drunk persons | Fatalites | Persons | Pedestrians |
|---|
| 1 | Jun 3, 1994 00:55 AM | I5 | 2 | 1
| 1 | 2 | - |
Shoreline fatal car crash and road traffic accident list for 1992
| # | Date | Location | Vehicles | Drunk persons | Fatalites | Persons | Pedestrians |
|---|
| 1 | Nov 5, 1992 11:01 PM | I5 | 2 | - | 1
| 5 | 1 |
Shoreline fatal car crash and road traffic accident list for 1991
| # | Date | Location | Vehicles | Drunk persons | Fatalites | Persons | Pedestrians |
|---|
| 1 | Mar 18, 1991 07:27 PM | I5 | 1 | - | 1
| 2 | - |
Shoreline fatal car crash and road traffic accident list for 1989
| # | Date | Location | Vehicles | Drunk persons | Fatalites | Persons | Pedestrians |
|---|
| 1 | Nov 26, 1989 08:25 PM | I5 | 2 | 1
| 1 | 5 | - |