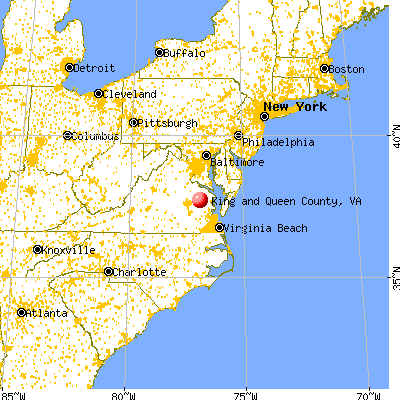
King and Queen County, Virginia (VA)
County owner-occupied free and clear houses and condos in 2010: 956
County owner-occupied houses and condos in 2000: 2,199
Renter-occupied apartments: 557 (it was 474 in 2000)
| % of renters here: | 18% |
| State: | 33% |
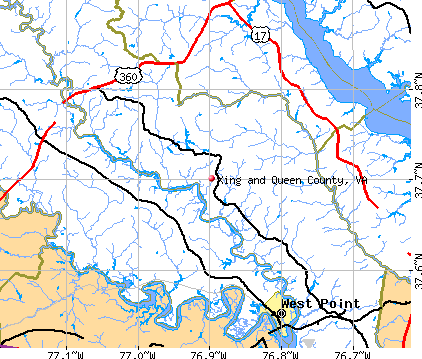
Land area: 316 sq. mi.
Water area: 10.1 sq. mi.
Population density: 21 people per square mile (low).
Industries providing employment: Educational, health and social services (27.8%).
Type of workers:
- Private wage or salary: 76%
- Government: 20%
- Self-employed, not incorporated: 4%
- Unpaid family work: 1%
- OSM Map
- General Map
- Google Map
- MSN Map

- 4,34264.8%White Non-Hispanic Alone
- 1,60423.9%Black Non-Hispanic Alone
- 4266.4%Two or more races
- 2543.8%Hispanic or Latino
- 500.7%Some other race alone
- 270.4%American Indian and Alaska Native alone

| Median resident age: | 47.8 years |
| Virginia median age: | 39.0 years |
| Males: 3,509 | |
| Females: 3,217 |

 | Henrico Country (Central VA) Map. (6 replies) |
| King and Queen County: | 2.0 people |
| Virginia: | 3 people |
Estimated median household income in 2022: $69,040 ($35,941 in 1999)
| This county: | $69,040 |
| Virginia: | $85,873 |
Median contract rent in 2022 for apartments: $710 (lower quartile is $620, upper quartile is $902)
| This county: | $710 |
| State: | $1270 |
Estimated median house or condo value in 2022: $228,697 (it was $82,000 in 2000)
| King and Queen: | $228,697 |
| Virginia: | $365,700 |
Mean price in 2022:
Median monthly housing costs for homes and condos with a mortgage: $1,267Detached houses: $300,179
Here: $300,179 State: $472,865 Mobile homes: $164,798
Here: $164,798 State: $100,736
Median monthly housing costs for units without a mortgage: $478
Institutionalized population: 0
Crime in 2021 (reported by the sheriff's office or county police, not the county total):
- Murders: 0
- Rapes: 0
- Robberies: 0
- Assaults: 5
- Burglaries: 6
- Thefts: 19
- Auto thefts: 0
Crime in 2020 (reported by the sheriff's office or county police, not the county total):
- Murders: 0
- Rapes: 0
- Robberies: 0
- Assaults: 7
- Burglaries: 5
- Thefts: 33
- Auto thefts: 2
Health of residents in King and Queen County based on CDC Behavioral Risk Factor Surveillance System Survey Questionnaires from 2013 to 2021:
General health status score of residents in this county from 1 (poor) to 5 (excellent) is 3.5. This is about average.73.5% of residents exercised in the past month. This is about average.
42.1% of residents smoked 100+ cigarettes in their lives. This is about average.
54.8% of adult residents drank alcohol in the past 30 days. This is less than average.
74.3% of residents visited a dentist within the past year. This is about average.
Average weight of males is 200 pounds. This is more than average.
Average weight of females is 167 pounds. This is more than average.
Single-family new house construction building permits:
- 2022: 37 buildings, average cost: $175,700
- 2021: 23 buildings, average cost: $262,700
- 2020: 26 buildings, average cost: $133,500
- 2019: 26 buildings, average cost: $164,400
- 2018: 15 buildings, average cost: $156,600
- 2017: 18 buildings, average cost: $148,400
- 2016: 25 buildings, average cost: $181,600
- 2015: 13 buildings, average cost: $173,800
- 2014: 13 buildings, average cost: $194,500
- 2013: 11 buildings, average cost: $230,300
- 2012: 16 buildings, average cost: $98,900
- 2011: 20 buildings, average cost: $176,000
- 2010: 25 buildings, average cost: $129,700
- 2009: 18 buildings, average cost: $150,900
- 2008: 50 buildings, average cost: $114,100
- 2007: 60 buildings, average cost: $134,400
- 2006: 67 buildings, average cost: $138,700
- 2005: 60 buildings, average cost: $137,500
- 2004: 45 buildings, average cost: $126,500
- 2003: 40 buildings, average cost: $105,800
- 2002: 44 buildings, average cost: $91,200
- 2001: 33 buildings, average cost: $124,000
- 2000: 24 buildings, average cost: $134,200
- 1999: 24 buildings, average cost: $97,900
- 1998: 26 buildings, average cost: $92,400
- 1997: 27 buildings, average cost: $73,300


Median real estate property taxes paid for housing units with mortgages in 2022: $1,282 (0.6%)
Median real estate property taxes paid for housing units with no mortgage in 2022: $1,097 (0.5%)


| King and Queen County: | 21.1% |
| Virginia: | 10.6% |
Median age of residents in 2022: 47.8 years old
(Males: 45.7 years old, Females: 53.0 years old)
(Median age for: White residents: 49.4 years old, Black residents: 53.3 years old, American Indian residents: 57.8 years old, Hispanic or Latino residents: 17.1 years old, Other race residents: 16.8 years old)
Area name: Richmond, VA HUD Metro FMR Area
Fair market rent in 2006 for a 1-bedroom apartment in King and Queen County is $678 a month.
Fair market rent for a 2-bedroom apartment is $757 a month.
Fair market rent for a 3-bedroom apartment is $1010 a month.
Cities in this county include: Newtown district, King and Queen Court House.
Neighboring counties: Hinsdale County, Colorado  , Fluvanna County , San Francisco County, California , Lee County, Kentucky , Madison County, Kentucky , Staunton city
  .
.
| Here: | 2.8% |
| Virginia: | 2.7% |


Current college students: 136
People 25 years of age or older with a high school degree or higher: 86.4%
People 25 years of age or older with a bachelor's degree or higher: 22.6%
Number of foreign born residents: 60 (85.6% naturalized citizens)
| King and Queen County: | 0.9% |
| Whole state: | 12.7% |

- Year of entry for the foreign-born population
- 92010 or later
- 42000 to 2009
- 01990 to 1999
- 171980 to 1989
- 301970 to 1979
- 11Before 1970
Mean travel time to work (commute): ! minutes
Percentage of county residents living and working in this county: 100.3%

Housing units in structures:
- One, detached: 2,922
- One, attached: 25
- Two: 20
- 3 or 4: 9
- Mobile homes: 524
Housing units in King and Queen County with a mortgage: 1,392 (165 second mortgage, 12 home equity loan, 128 both second mortgage and home equity loan)
Houses without a mortgage: 32
| Here: | 3.0% with mortgage |
| State: | 97.2% with mortgage |
Religion statistics for King and Queen County
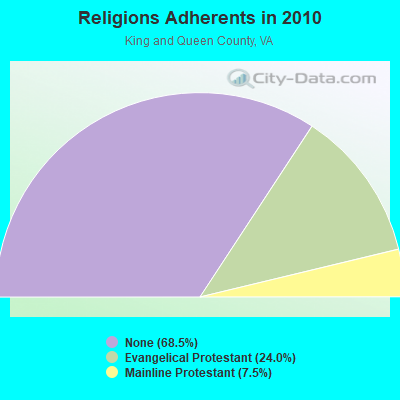
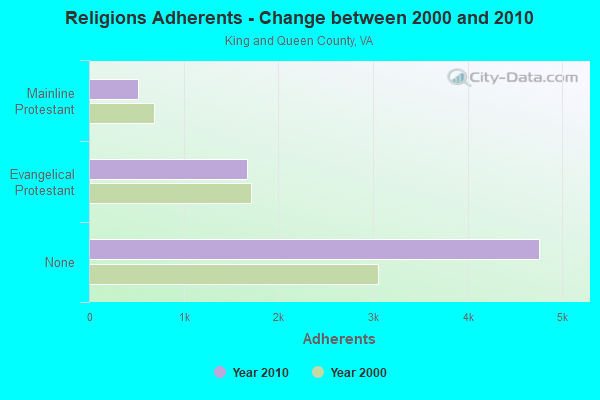
| Religion | Adherents | Congregations |
|---|---|---|
| Evangelical Protestant | 1,667 | 10 |
| Mainline Protestant | 518 | 6 |
| Other | 1 | 1 |
| None | 4,759 | - |
Source: Clifford Grammich, Kirk Hadaway, Richard Houseal, Dale E.Jones, Alexei Krindatch, Richie Stanley and Richard H.Taylor. 2012. 2010 U.S.Religion Census: Religious Congregations & Membership Study. Association of Statisticians of American Religious Bodies. Jones, Dale E., et al. 2002. Congregations and Membership in the United States 2000. Nashville, TN: Glenmary Research Center.
Food Environment Statistics:
| This county: | 1.46 / 10,000 pop. |
| Virginia: | 1.43 / 10,000 pop. |
| King and Queen County: | 5.83 / 10,000 pop. |
| Virginia: | 4.03 / 10,000 pop. |
| This county: | 1.46 / 10,000 pop. |
| State: | 7.65 / 10,000 pop. |
| King and Queen County: | 11.8% |
| Virginia: | 9.3% |
| King and Queen County: | 29.9% |
| State: | 26.7% |
| Here: | 20.5% |
| State: | 18.6% |
Agriculture in King and Queen County:
Average size of farms: 382 acresAverage value of agricultural products sold per farm: $45,795
Average value of crops sold per acre for harvested cropland: $176.01
The value of nursery, greenhouse, floriculture, and sod as a percentage of the total market value of agricultural products sold: 5.76%
The value of livestock, poultry, and their products as a percentage of the total market value of agricultural products sold: 23.99%
Average total farm production expenses per farm: $53,880
Harvested cropland as a percentage of land in farms: 51.73%
Average market value of all machinery and equipment per farm: $58,347
The percentage of farms operated by a family or individual: 77.92%
Average age of principal farm operators: 57 years
Average number of cattle and calves per 100 acres of all land in farms: 2.56
Corn for grain: 12173 harvested acres
All wheat for grain: 3447 harvested acres
Soybeans for beans: 14533 harvested acres
Vegetables: 33 harvested acres
Earthquake activity:
King and Queen County-area historical earthquake activity is significantly above Virginia state average. It is 58% smaller than the overall U.S. average.On 8/23/2011 at 17:51:04, a magnitude 5.8 (5.8 MW, Depth: 3.7 mi, Class: Moderate, Intensity: VI - VII) earthquake occurred 58.5 miles away from King and Queen County center
On 12/9/2003 at 20:59:14, a magnitude 4.5 (4.5 MB, 4.5 LG, Class: Light, Intensity: IV - V) earthquake occurred 55.6 miles away from the county center
On 8/25/2011 at 05:07:52, a magnitude 4.5 (4.5 ML, Depth: 4.2 mi) earthquake occurred 60.8 miles away from the county center
On 12/9/2003 at 20:59:18, a magnitude 4.5 (4.5 ML, Depth: 6.2 mi) earthquake occurred 65.9 miles away from the county center
On 8/24/2011 at 00:04:36, a magnitude 4.2 (4.2 ML) earthquake occurred 59.6 miles away from King and Queen County center
On 8/9/2020 at 12:07:37, a magnitude 5.1 (5.1 MW, Depth: 4.7 mi) earthquake occurred 246.5 miles away from the county center
Magnitude types: regional Lg-wave magnitude (LG), body-wave magnitude (MB), local magnitude (ML), moment magnitude (MW)
Most recent natural disasters:
- Virginia Covid-19 Pandemic, Incident Period: January 20, 2020, Major Disaster (Presidential) Declared DR-4512-VA: April 2, 2020, FEMA Id: 4512, Natural disaster type: Other
- Virginia Tropical Storm Michael, Incident Period: October 9, 2018 - October 16, 2018, FEMA Id: 4411, Natural disaster type: Tropical Storm
- Virginia Hurricane Florence, Incident Period: September 8, 2018 - September 21, 2018, FEMA Id: 4401, Natural disaster type: Hurricane
The number of natural disasters in King and Queen County (3) is a lot smaller than the US average (15).
Major Disasters (Presidential) Declared: 1

Means of transportation to work:
- Drove a car alone: 772 (59.9%)
- Carpooled: 118 (9.2%)
- Taxicab, motorcycle, or other means: 12 (0.9%)
- Walked: 32 (2.5%)
- Worked at home: 405 (31.4%)


- Health care and social assistance (17%)
- Retail trade (10%)
- Educational services (9%)
- Public administration (7%)
- Transportation and warehousing (6%)
- Accommodation and food services (6%)
- Professional, scientific, and technical services (5%)

- Health care and social assistance (22%)
- Retail trade (13%)
- Educational services (11%)
- Public administration (9%)
- Transportation and warehousing (8%)
- Accommodation and food services (8%)
- Professional, scientific, and technical services (7%)

- Management occupations (18%)
- Construction and extraction occupations (18%)
- Computer and mathematical occupations (12%)
- Transportation occupations (10%)
- Installation, maintenance, and repair occupations (8%)
- Building and grounds cleaning and maintenance occupations (7%)
- Healthcare support occupations (5%)

- Office and administrative support occupations (14%)
- Sales and related occupations (13%)
- Food preparation and serving related occupations (11%)
- Business and financial operations occupations (11%)
- Management occupations (10%)
- Healthcare support occupations (8%)
- Educational instruction, and library occupations (7%)

- Mexico (32%)
- Germany (17%)
- Canada (17%)
- Nigeria (15%)
- Colombia (10%)
- Norway (2%)
- England (0%)

- American (28%)
- English (22%)
- Italian (4%)
- Irish (3%)
- African (3%)
- German (2%)
- British (2%)


8.92% of this county's 2021 resident taxpayers lived in other counties in 2020 ($49,279 average adjusted gross income)
| Here: | 8.92% |
| Virginia average: | 10.16% |
10 or fewer of this county's residents moved from foreign countries.
8.18% relocated from other counties in Virginia ($46,112 average AGI)
0.74% relocated from other states ($3,167 average AGI)
King and Queen County: 0.74% Virginia average: 3.91%

Top counties from which taxpayers relocated into this county between 2020 and 2021:
| from King William County, VA | |
| from Essex County, VA | |
| from Hanover County, VA |
7.02% of this county's 2020 resident taxpayers moved to other counties in 2021 ($56,389 average adjusted gross income)
| Here: | 7.02% |
| Virginia average: | 10.20% |
10 or fewer of this county's residents moved to foreign countries.
6.11% relocated to other counties in Virginia ($46,341 average AGI)
0.91% relocated to other states ($10,049 average AGI)
King and Queen County: 0.91% Virginia average: 3.98%

Top counties to which taxpayers relocated from this county between 2020 and 2021:
| to King William County, VA |
Births per 1000 population from 1990 to 1999: 12.6
Births per 1000 population from 2000 to 2006: 10.6

Deaths per 1000 population from 1990 to 1999: 11.3
Deaths per 1000 population from 2000 to 2009: 12.0
Deaths per 1000 population from 2010 to 2020: 12.1

Infant deaths per 1000 live births from 1990 to 1999: 10.2
Infant deaths per 1000 live births from 2000 to 2006: 9.5

Persons under 19 years old without health insurance coverage in 2018: 7.4%


Persons enrolled in hospital insurance and/or supplemental medical insurance (Medicare) in July 1, 2007: 1,213 (967 aged, 246 disabled)
Children under 18 without health insurance coverage in 2007: 160 (11%)


Most common underlying causes of death in King and Queen County, Virginia in 1999 - 2019:
- Bronchus or lung, unspecified - Malignant neoplasms (21)
Population without health insurance coverage in 2000: 13%
Children under 18 without health insurance coverage in 2000: 9%
Medical specialist MDs per 100,000 population in 2005: 1,074
Total births per 100,000 population, July 2005 - July 2006 : 15
Total deaths per 100,000 population, July 2005 - July 2006: 15
Household type by relationship:
Households: 6,726- Male householders: 1,525 (350 living alone), Female householders: 1,377 (444 living alone)
1,527 spouses (1,527 opposite-sex spouses), 200 unmarried partners, (188 opposite-sex unmarried partners), 1,537 children (1,363 natural, 94 adopted, 71 stepchildren), 322 grandchildren, 37 brothers or sisters, 57 parents, 0 foster children, 85 other relatives, 61 non-relatives
Size of family households: 1,088 2-persons, 463 3-persons, 216 4-persons, 124 5-persons, 27 6-persons, 43 7-or-more-persons.
Size of nonfamily households: 795 1-person, 139 2-persons, 8 3-persons.
718 married couples with children.
177 single-parent households (27 men, 150 women).
97.9% of residents of King and Queen speak English at home.
1.4% of residents speak Spanish at home (34% speak English very well, 66% speak English well).
0.2% of residents speak other Indo-European language at home (100% speak English very well).
0.4% of residents speak other language at home (100% speak English very well).
In fiscal year 2004:
Federal Government expenditure: $35,173,000 ($5,192 per capita)
Department of Defense expenditure: $1,044,000
Federal direct payments to individuals for retirement and disability: $19,100,000
Federal other direct payments to individuals: $7,722,000
Federal direct payments not to individuals: $1,526,000
Federal grants: $4,521,000
Federal procurement contracts: $264,000 ($0,000 Department of Defense)
Federal salaries and wages: $2,041,000 ($0,000 Department of Defense)
Federal Government direct loans: $234,000
Federal guaranteed/insured loans: $2,197,000
Federal Government insurance: $10,684,000
Population change from April 1, 2000 to July 1, 2005:
Births: 378| Here: | 56 per 1000 residents |
| State: | 70 per 1000 residents |
Deaths: 462
| Here: | 68 per 1000 residents |
| State: | 40 per 1000 residents |
Net international migration: 0
| Here: | 0 per 1000 residents |
| State: | +18 per 1000 residents |
Net internal migration: +262
| Here: | +39 per 1000 residents |
| State: | +14 per 1000 residents |

Total withdrawal of fresh water for public supply: 0.01 millions of gallons per day (all from ground)
| Here: | 6.6 |
| State: | 7.0 |
| Here: | 6.1 |
| State: | 4.3 |

- Year house built in King and Queen County, Virginia
- 192020 or later
- 3312010 to 2019
- 6872000 to 2009
- 6571990 to 1999
- 4791980 to 1989
- 3351970 to 1979
- 1871960 to 1969
- 3401950 to 1959
- 861940 to 1949
- 3731939 or earlier

- Rooms in owner-occupied houses in King and Queen County, Virginia
- 01 room
- 02 rooms
- 253 rooms
- 1014 rooms
- 5135 rooms
- 4476 rooms
- 5837 rooms
- 2228 rooms
- 3659+ rooms

- Rooms in renter-occupied apartments in King and Queen County, Virginia
- 01 room
- 02 rooms
- 73 rooms
- 664 rooms
- 815 rooms
- 2276 rooms
- 457 rooms
- 858 rooms
- 1199+ rooms

- Bedrooms in owner-occupied houses in King and Queen County, Virginia
- 0no bedroom
- 671 bedroom
- 4312 bedrooms
- 1,3333 bedrooms
- 3744 bedrooms
- 575+ bedrooms

- Bedrooms in renter-occupied apartments in King and Queen County, Virginia
- 0no bedroom
- 01 bedroom
- 1302 bedrooms
- 3933 bedrooms
- 604 bedrooms
- 475+ bedrooms

- Cars and other vehicles available in King and Queen County in owner-occupied houses/condos
- 121no vehicle
- 5031 vehicle
- 6602 vehicles
- 5903 vehicles
- 2244 vehicles
- 1725+ vehicles

- Cars and other vehicles available in King and Queen County in renter-occupied apartments
- 0no vehicle
- 2511 vehicle
- 2182 vehicles
- 713 vehicles
- 414 vehicles
- 565+ vehicles
94.7% of King and Queen County residents lived in the same house 1 years ago.
Out of people who lived in different houses, 9% lived in this county.
Out of people who lived in different counties, 61% lived in Virginia.
| King and Queen County: | 94.7% |
| State average: | 86.6% |
Place of birth for U.S.-born residents:
- This state: 5,017
- Other state: 1,538
- Northeast: 404
- Midwest: 511
- South: 509
- West: 103


- 81.2%Electricity
- 7.7%Bottled, tank, or LP gas
- 4.7%Wood
- 4.5%Fuel oil, kerosene, etc.
- 1.3%No fuel used
- 0.6%Utility gas

- 71.2%Electricity
- 14.7%Fuel oil, kerosene, etc.
- 6.5%Utility gas
- 5.5%Bottled, tank, or LP gas
- 2.1%Wood
Private vs. public school enrollment:
| Here: | 7.9% |
| Virginia: | 13.2% |
| Here: | 10.7% |
| Virginia: | 10.2% |
| Here: | 8.3% |
| Virginia: | 18.7% |


King and Queen County government finances - Expenditure in 2017:
- Charges - Solid Waste Management: $2,110,000
Elementary and Secondary Education School Lunch: $90,000
Other: $64,000
Elementary and Secondary Education School Tuition and Transportation: $2,000
- Current Operations - Elementary and Secondary Education: $10,210,000
Police Protection: $1,533,000
Central Staff Services: $876,000
Local Fire Protection: $624,000
Correctional Institutions: $413,000
Solid Waste Management: $411,000
Judicial and Legal Services: $332,000
Financial Administration: $216,000
General Public Buildings: $184,000
General - Other: $178,000
Libraries: $163,000
Health - Other: $133,000
Protective Inspection and Regulation - Other: $46,000
Corrections - Other: $3,000
- Federal Intergovernmental - Public Welfare: $606,000
Education: $88,000
Other: $22,000
- General - Interest on Debt: $69,000
- Intergovernmental to Local - Other - Elementary and Secondary Education: $120,000
- Local Intergovernmental - Education: $195,000
Other: $18,000
- Long Term Debt - Beginning Outstanding - Unspecified Public Purpose: $1,736,000
Outstanding Unspecified Public Purpose: $1,210,000
Retired Unspecified Public Purpose: $526,000
- Miscellaneous - General Revenue - Other: $332,000
Fines and Forfeits: $126,000
Rents: $66,000
- Other Capital Outlay - Elementary and Secondary Education: $218,000
- Other Funds - Cash and Securities: $23,839,000
- State Intergovernmental - Education: $6,266,000
General Local Government Support: $1,772,000
Other: $352,000
Public Welfare: $295,000
- Tax - Property: $7,040,000
Other Selective Sales: $209,000
Public Utility License: $193,000
Motor Vehicle License: $191,000
General Sales and Gross Receipts: $172,000
Other License: $75,000
Occupation and Business License - Other: $19,000
Other: $6,000
- Total Salaries and Wages: $5,856,000
King and Queen County government finances - Revenue in 2017:
- Charges - Solid Waste Management: $2,110,000
Elementary and Secondary Education School Lunch: $90,000
Other: $64,000
Elementary and Secondary Education School Tuition and Transportation: $2,000
- Current Operations - Elementary and Secondary Education: $10,210,000
Police Protection: $1,533,000
Central Staff Services: $876,000
Local Fire Protection: $624,000
Correctional Institutions: $413,000
Solid Waste Management: $411,000
Judicial and Legal Services: $332,000
Financial Administration: $216,000
General Public Buildings: $184,000
General - Other: $178,000
Libraries: $163,000
Health - Other: $133,000
Protective Inspection and Regulation - Other: $46,000
Corrections - Other: $3,000
- Federal Intergovernmental - Public Welfare: $606,000
Education: $88,000
Other: $22,000
- General - Interest on Debt: $69,000
- Intergovernmental to Local - Other - Elementary and Secondary Education: $120,000
- Local Intergovernmental - Education: $195,000
Other: $18,000
- Long Term Debt - Beginning Outstanding - Unspecified Public Purpose: $1,736,000
Outstanding Unspecified Public Purpose: $1,210,000
Retired Unspecified Public Purpose: $526,000
- Miscellaneous - General Revenue - Other: $332,000
Fines and Forfeits: $126,000
Rents: $66,000
- Other Capital Outlay - Elementary and Secondary Education: $218,000
- Other Funds - Cash and Securities: $23,839,000
- State Intergovernmental - Education: $6,266,000
General Local Government Support: $1,772,000
Other: $352,000
Public Welfare: $295,000
- Tax - Property: $7,040,000
Other Selective Sales: $209,000
Public Utility License: $193,000
Motor Vehicle License: $191,000
General Sales and Gross Receipts: $172,000
Other License: $75,000
Occupation and Business License - Other: $19,000
Other: $6,000
- Total Salaries and Wages: $5,856,000
King and Queen County government finances - Debt in 2017:
- Charges - Solid Waste Management: $2,110,000
Elementary and Secondary Education School Lunch: $90,000
Other: $64,000
Elementary and Secondary Education School Tuition and Transportation: $2,000
- Current Operations - Elementary and Secondary Education: $10,210,000
Police Protection: $1,533,000
Central Staff Services: $876,000
Local Fire Protection: $624,000
Correctional Institutions: $413,000
Solid Waste Management: $411,000
Judicial and Legal Services: $332,000
Financial Administration: $216,000
General Public Buildings: $184,000
General - Other: $178,000
Libraries: $163,000
Health - Other: $133,000
Protective Inspection and Regulation - Other: $46,000
Corrections - Other: $3,000
- Federal Intergovernmental - Public Welfare: $606,000
Education: $88,000
Other: $22,000
- General - Interest on Debt: $69,000
- Intergovernmental to Local - Other - Elementary and Secondary Education: $120,000
- Local Intergovernmental - Education: $195,000
Other: $18,000
- Long Term Debt - Beginning Outstanding - Unspecified Public Purpose: $1,736,000
Outstanding Unspecified Public Purpose: $1,210,000
Retired Unspecified Public Purpose: $526,000
- Miscellaneous - General Revenue - Other: $332,000
Fines and Forfeits: $126,000
Rents: $66,000
- Other Capital Outlay - Elementary and Secondary Education: $218,000
- Other Funds - Cash and Securities: $23,839,000
- State Intergovernmental - Education: $6,266,000
General Local Government Support: $1,772,000
Other: $352,000
Public Welfare: $295,000
- Tax - Property: $7,040,000
Other Selective Sales: $209,000
Public Utility License: $193,000
Motor Vehicle License: $191,000
General Sales and Gross Receipts: $172,000
Other License: $75,000
Occupation and Business License - Other: $19,000
Other: $6,000
- Total Salaries and Wages: $5,856,000
King and Queen County government finances - Cash and Securities in 2017:
- Charges - Solid Waste Management: $2,110,000
Elementary and Secondary Education School Lunch: $90,000
Other: $64,000
Elementary and Secondary Education School Tuition and Transportation: $2,000
- Current Operations - Elementary and Secondary Education: $10,210,000
Police Protection: $1,533,000
Central Staff Services: $876,000
Local Fire Protection: $624,000
Correctional Institutions: $413,000
Solid Waste Management: $411,000
Judicial and Legal Services: $332,000
Financial Administration: $216,000
General Public Buildings: $184,000
General - Other: $178,000
Libraries: $163,000
Health - Other: $133,000
Protective Inspection and Regulation - Other: $46,000
Corrections - Other: $3,000
- Federal Intergovernmental - Public Welfare: $606,000
Education: $88,000
Other: $22,000
- General - Interest on Debt: $69,000
- Intergovernmental to Local - Other - Elementary and Secondary Education: $120,000
- Local Intergovernmental - Education: $195,000
Other: $18,000
- Long Term Debt - Beginning Outstanding - Unspecified Public Purpose: $1,736,000
Outstanding Unspecified Public Purpose: $1,210,000
Retired Unspecified Public Purpose: $526,000
- Miscellaneous - General Revenue - Other: $332,000
Fines and Forfeits: $126,000
Rents: $66,000
- Other Capital Outlay - Elementary and Secondary Education: $218,000
- Other Funds - Cash and Securities: $23,839,000
- State Intergovernmental - Education: $6,266,000
General Local Government Support: $1,772,000
Other: $352,000
Public Welfare: $295,000
- Tax - Property: $7,040,000
Other Selective Sales: $209,000
Public Utility License: $193,000
Motor Vehicle License: $191,000
General Sales and Gross Receipts: $172,000
Other License: $75,000
Occupation and Business License - Other: $19,000
Other: $6,000
- Total Salaries and Wages: $5,856,000
Supplemental Security Income (SSI) in 2006:
- Total number of recipients: 147
- Number of aged recipients: 22
- Number of blind and disabled recipients: 125
- Number of recipients under 18: 33
- Number of recipients between 18 and 64: 83
- Number of recipients older than 64: 31
- Number of recipients also receiving OASDI: 63
- Amount of payments (thousands of dollars): 79
King and Queen County on our top lists:
- #5 on the list of "Top 101 counties with the lowest total withdrawal of fresh water for public supply"
- #9 on the list of "Top 101 counties with the lowest ground withdrawal of fresh water for public supply"