Sussex County, Delaware (DE)
County owner-occupied free and clear houses and condos in 2010: 24,107
County owner-occupied houses and condos in 2000: 50,505
Renter-occupied apartments: 17,015 (it was 12,072 in 2000)
| % of renters here: | 19% |
| State: | 28% |
Land area: 938 sq. mi.
Water area: 258.1 sq. mi.
Population density: 273 people per square mile (high).
Industries providing employment: Educational, health and social services (21.9%), Retail trade (13.2%), Professional, scientific, management, administrative, and waste management services (11.9%).
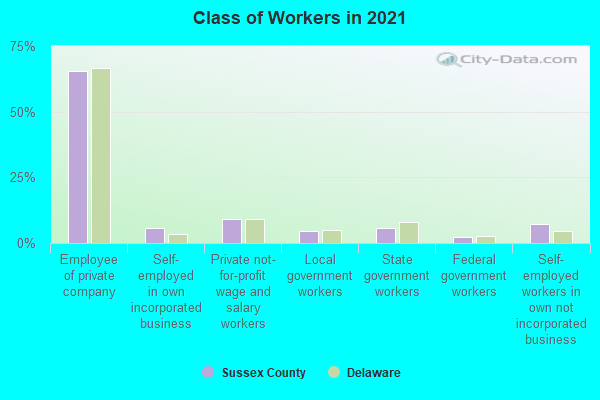
Type of workers:
- Private wage or salary: 81%
- Government: 13%
- Self-employed, not incorporated: 6%
- Unpaid family work: 0%
- OSM Map
- General Map
- Google Map
- MSN Map

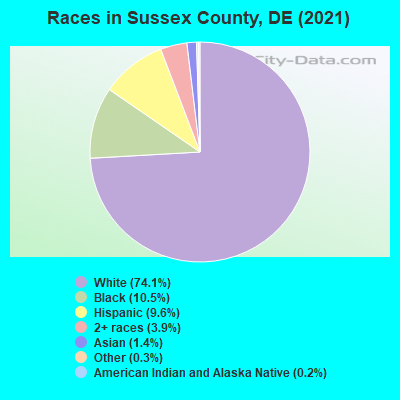
- 188,86673.8%White Non-Hispanic Alone
- 26,42810.3%Black Non-Hispanic Alone
- 24,8789.7%Hispanic or Latino
- 11,6354.5%Two or more races
- 2,7161.1%Asian alone
- 9340.4%Some other race alone
- 4990.2%American Indian and Alaska Native alone
| Median resident age: | 52.7 years |
| Delaware median age: | 41.5 years |
| Males: 124,097 | |
| Females: 131,859 |

 | Which office in Sussex County keeps old property surveys, if any? (3 replies) |
| Planned Communities in Sussex County (46 replies) |
| What's with garbage/garbage collection in Sussex County (16 replies) |
| Basememnts in Sussex County? (10 replies) |
| Coronavirus in Delaware: a place to share news, tips, information (1873 replies) |
| Another 60+er considering move to DE (10 replies) |
| Sussex County: | 2.0 people |
| Delaware: | 3 people |
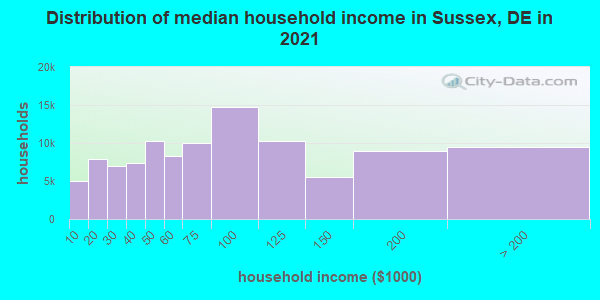
Estimated median household income in 2022: $81,792 ($39,208 in 1999)
| This county: | $81,792 |
| Delaware: | $82,174 |
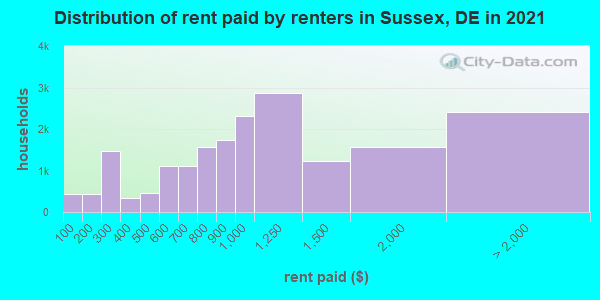
Median contract rent in 2022 for apartments: $897 (lower quartile is $639, upper quartile is $1,334)
| This county: | $897 |
| State: | $1109 |
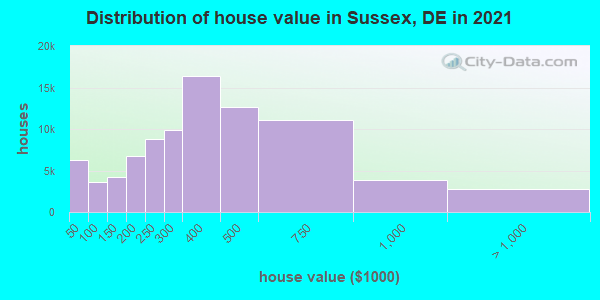
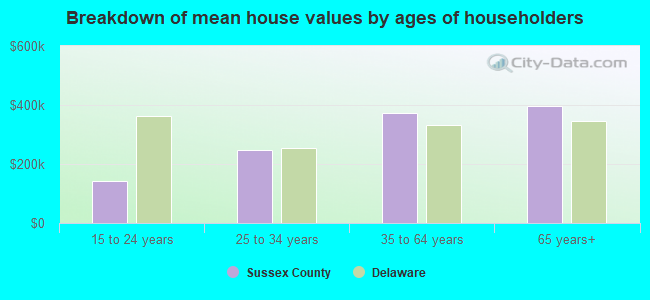
Estimated median house or condo value in 2022: $382,700 (it was $99,700 in 2000)
| Sussex: | $382,700 |
| Delaware: | $337,200 |
Mean price in 2022:
Median monthly housing costs for homes and condos with a mortgage: $1,569Detached houses: $465,191
Here: $465,191 State: $419,599 Townhouses or other attached units: $393,834
Here: $393,834 State: $291,415 In 2-unit structures: $614,189
Here: $614,189 State: $301,231 In 3-to-4-unit structures: $568,280
Here: $568,280 State: $543,616 In 5-or-more-unit structures: $258,913
Here: $258,913 State: $212,751 Mobile homes: $109,106
Here: $109,106 State: $106,273 Occupied boats, RVs, vans, etc.: $136,533
Here: $136,533 State: $199,088
Median monthly housing costs for units without a mortgage: $480
Institutionalized population: 2,685
Health of residents in Sussex County based on CDC Behavioral Risk Factor Surveillance System Survey Questionnaires from 2003 to 2012:
General health status score of residents in this county from 1 (poor) to 5 (excellent) is 3.5. This is about average.72.6% of residents exercised in the past month. This is about average.
54.8% of residents smoked 100+ cigarettes in their lives. This is more than average.
72.2% of adult residents drank alcohol in the past 30 days. This is about average.
71.8% of residents visited a dentist within the past year. This is about average.
Average weight of males is 198 pounds. This is about average.
Average weight of females is 167 pounds. This is more than average.
35.1% of residents keep firearms around their homes. This is more than average.
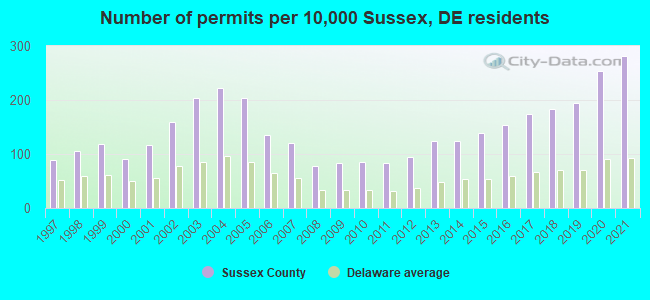
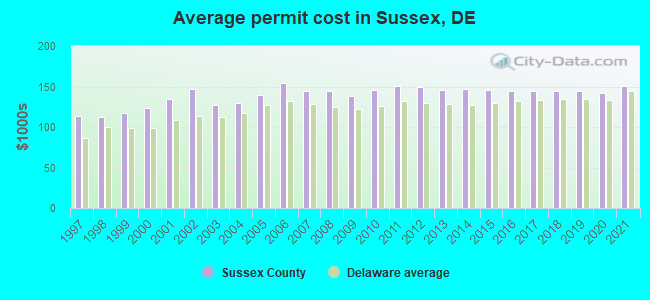
Single-family new house construction building permits:
- 2022: 3764 buildings, average cost: $150,500
- 2021: 4395 buildings, average cost: $149,800
- 2020: 3971 buildings, average cost: $141,500
- 2019: 3041 buildings, average cost: $143,700
- 2018: 2875 buildings, average cost: $145,100
- 2017: 2727 buildings, average cost: $144,400
- 2016: 2399 buildings, average cost: $144,100
- 2015: 2166 buildings, average cost: $145,500
- 2014: 1943 buildings, average cost: $146,900
- 2013: 1942 buildings, average cost: $145,800
- 2012: 1481 buildings, average cost: $148,600
- 2011: 1311 buildings, average cost: $149,500
- 2010: 1334 buildings, average cost: $146,400
- 2009: 1318 buildings, average cost: $137,600
- 2008: 1215 buildings, average cost: $144,800
- 2007: 1903 buildings, average cost: $144,900
- 2006: 2121 buildings, average cost: $153,800
- 2005: 3200 buildings, average cost: $140,400
- 2004: 3477 buildings, average cost: $130,400
- 2003: 3184 buildings, average cost: $126,500
- 2002: 2510 buildings, average cost: $146,700
- 2001: 1825 buildings, average cost: $134,100
- 2000: 1422 buildings, average cost: $122,500
- 1999: 1844 buildings, average cost: $117,300
- 1998: 1647 buildings, average cost: $111,800
- 1997: 1377 buildings, average cost: $114,100
Median real estate property taxes paid for housing units with mortgages in 2022: $1,232 (0.3%)
Median real estate property taxes paid for housing units with no mortgage in 2022: $1,092 (0.3%)
| Sussex County: | 8.9% |
| Delaware: | 9.4% |
Median age of residents in 2022: 52.7 years old
(Males: 51.2 years old, Females: 54.2 years old)
(Median age for: White residents: 58.9 years old, Black residents: 38.1 years old, American Indian residents: 37.4 years old, Asian residents: 51.8 years old, Hispanic or Latino residents: 24.2 years old, Other race residents: 25.4 years old)
Fair market rent in 2006 for a 1-bedroom apartment in Sussex County is $572 a month.
Fair market rent for a 2-bedroom apartment is $635 a month.
Fair market rent for a 3-bedroom apartment is $869 a month.
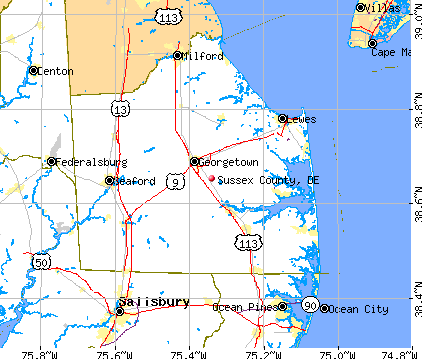
Cities in this county include: Milford, Seaford, Georgetown, Laurel, Lewes, Millsboro, Milton, Selbyville, Long Neck, Rehoboth Beach.
Neighboring counties: Dearborn County, Indiana  , Kiowa County, Colorado , Geary County, Kansas , McPherson County, Kansas , Russell County, Kansas , Fairfax city, Virginia .
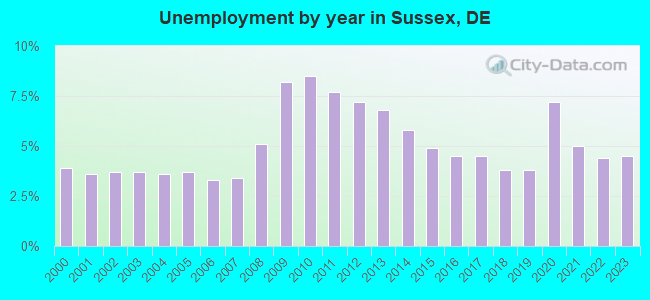
| Here: | 3.9% |
| Delaware: | 3.7% |
Current college students: 5,455
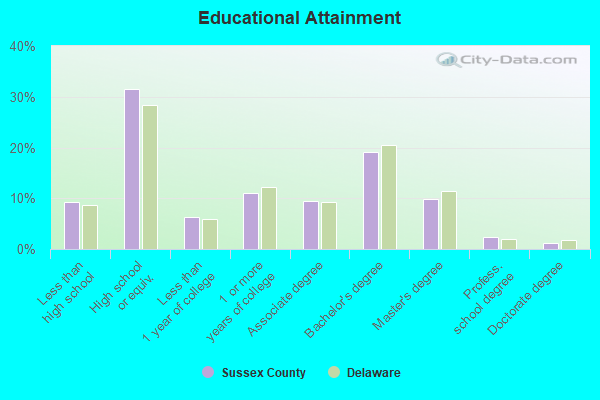
People 25 years of age or older with a high school degree or higher: 90.8%
People 25 years of age or older with a bachelor's degree or higher: 36.3%
Number of foreign born residents: 18,975 (39.2% naturalized citizens)
| Sussex County: | 7.4% |
| Whole state: | 9.9% |
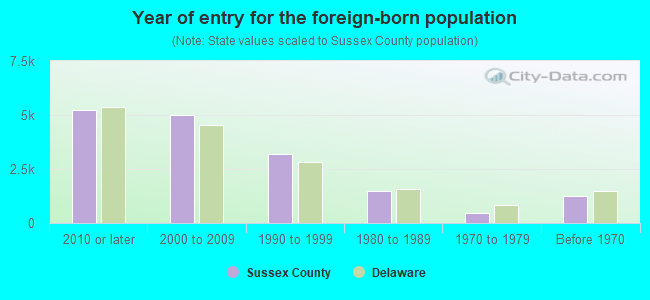
- Year of entry for the foreign-born population
- 6,2232010 or later
- 5,1742000 to 2009
- 2,8041990 to 1999
- 1,4621980 to 1989
- 4591970 to 1979
- 1,237Before 1970
Mean travel time to work (commute): minutes
Percentage of county residents living and working in this county: 85.8%
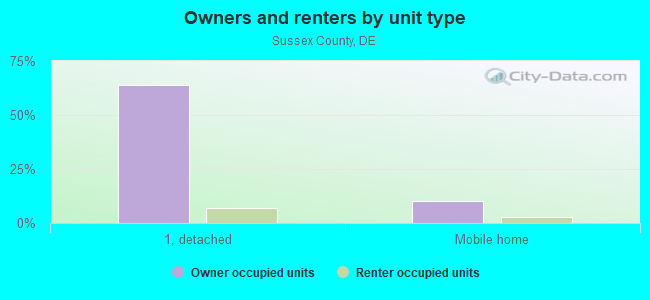
Housing units in structures:
- One, detached: 102,326
- One, attached: 17,035
- Two: 1,269
- 3 or 4: 2,781
- 5 to 9: 3,197
- 10 to 19: 3,930
- 20 to 49: 1,682
- 50 or more: 2,241
- Mobile homes: 17,755
- Boats, RVs, vans, etc.: 53
Housing units in Sussex County with a mortgage: 48,332 (3,675 second mortgage, 0 home equity loan, 2,960 both second mortgage and home equity loan)
Houses without a mortgage: 1,673
| Here: | 98.0% with mortgage |
| State: | 96.7% with mortgage |
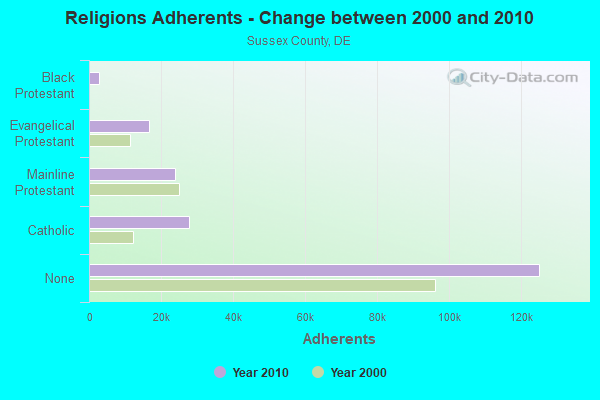
Religion statistics for Sussex County
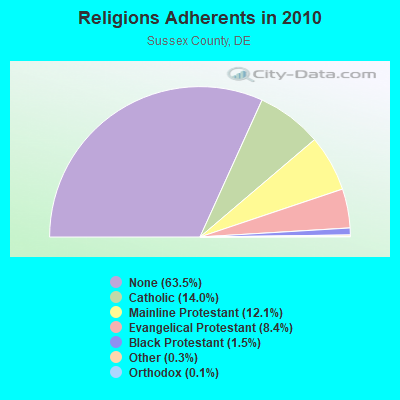
| Religion | Adherents | Congregations |
|---|---|---|
| Catholic | 27,681 | 7 |
| Mainline Protestant | 23,803 | 107 |
| Evangelical Protestant | 16,640 | 115 |
| Black Protestant | 2,914 | 21 |
| Other | 655 | 8 |
| Orthodox | 220 | 2 |
| None | 125,232 | - |
Source: Clifford Grammich, Kirk Hadaway, Richard Houseal, Dale E.Jones, Alexei Krindatch, Richie Stanley and Richard H.Taylor. 2012. 2010 U.S.Religion Census: Religious Congregations & Membership Study. Association of Statisticians of American Religious Bodies. Jones, Dale E., et al. 2002. Congregations and Membership in the United States 2000. Nashville, TN: Glenmary Research Center.
Food Environment Statistics:
| Sussex County: | 2.45 / 10,000 pop. |
| State: | 1.74 / 10,000 pop. |
| Here: | 0.16 / 10,000 pop. |
| Delaware: | 0.09 / 10,000 pop. |
| This county: | 0.98 / 10,000 pop. |
| Delaware: | 1.25 / 10,000 pop. |
| Sussex County: | 4.62 / 10,000 pop. |
| Delaware: | 2.84 / 10,000 pop. |
| This county: | 12.84 / 10,000 pop. |
| State: | 7.43 / 10,000 pop. |
| Sussex County: | 10.9% |
| Delaware: | 9.0% |
| Sussex County: | 28.9% |
| State: | 27.9% |
Agriculture in Sussex County:
Average size of farms: 216 acresAverage value of agricultural products sold per farm: $352,769
Average value of crops sold per acre for harvested cropland: $325.69
The value of nursery, greenhouse, floriculture, and sod as a percentage of the total market value of agricultural products sold: 2.11%
The value of livestock, poultry, and their products as a percentage of the total market value of agricultural products sold: 84.25%
Average total farm production expenses per farm: $260,795
Harvested cropland as a percentage of land in farms: 78.94%
Average market value of all machinery and equipment per farm: $112,411
The percentage of farms operated by a family or individual: 82.93%
Average age of principal farm operators: 54 years
Average number of cattle and calves per 100 acres of all land in farms: 3.34
Milk cows as a percentage of all cattle and calves: 29.79%
Corn for grain: 100417 harvested acres
All wheat for grain: 20959 harvested acres
Soybeans for beans: 86229 harvested acres
Vegetables: 21,732 harvested acres
Earthquake activity:
Sussex County-area historical earthquake activity is significantly above Delaware state average. It is 66% smaller than the overall U.S. average.On 8/23/2011 at 17:51:04, a magnitude 5.8 (5.8 MW, Depth: 3.7 mi, Class: Moderate, Intensity: VI - VII) earthquake occurred 149.9 miles away from Sussex County center
On 1/16/1994 at 01:49:16, a magnitude 4.6 (4.6 MB, 4.6 LG, Depth: 3.1 mi, Class: Light, Intensity: IV - V) earthquake occurred 121.9 miles away from the county center
On 11/30/2017 at 21:47:31, a magnitude 4.1 (4.1 MW, Depth: 6.1 mi) earthquake occurred 38.1 miles away from the county center
On 1/15/2019 at 23:30:48, a magnitude 4.6 (4.6 MW, Depth: 6.2 mi) earthquake occurred 160.7 miles away from the county center
On 8/25/2011 at 05:07:52, a magnitude 4.5 (4.5 ML, Depth: 4.2 mi) earthquake occurred 150.6 miles away from Sussex County center
On 12/9/2003 at 20:59:14, a magnitude 4.5 (4.5 MB, 4.5 LG) earthquake occurred 157.6 miles away from the county center
Magnitude types: regional Lg-wave magnitude (LG), body-wave magnitude (MB), local magnitude (ML), moment magnitude (MW)
Most recent natural disasters:
- Delaware Covid-19 Pandemic, Incident Period: January 20, 2020, Major Disaster (Presidential) Declared DR-4526-DE: April 5, 2020, FEMA Id: 4526, Natural disaster type: Other
- Delaware Severe Winter Storm and Flooding, Incident Period: January 22, 2016 to January 23, 2016, Major Disaster (Presidential) Declared DR-4265: March 16, 2016, FEMA Id: 4265, Natural disaster type: Winter Storm, Flood
- Delaware Hurricane Sandy, Incident Period: October 27, 2012 to November 08, 2012, Emergency Declared EM-3357: October 29, 2012, FEMA Id: 3357, Natural disaster type: Hurricane
- Delaware Hurricane Sandy, Incident Period: October 27, 2012 to November 08, 2012, Major Disaster (Presidential) Declared DR-4090: November 16, 2012, FEMA Id: 4090, Natural disaster type: Hurricane
- Delaware Hurricane Irene, Incident Period: August 26, 2011, Emergency Declared EM-3336: August 28, 2011, FEMA Id: 3336, Natural disaster type: Hurricane
- Delaware Hurricane Irene, Incident Period: August 25, 2011 to August 31, 2011, Major Disaster (Presidential) Declared DR-4037: September 30, 2011, FEMA Id: 4037, Natural disaster type: Hurricane
- Delaware Severe Winter Storms and Snowstorms, Incident Period: February 05, 2010 to February 11, 2010, Major Disaster (Presidential) Declared DR-1896: March 31, 2010, FEMA Id: 1896, Natural disaster type: Snowstorm, Winter Storm
- Delaware Severe Storms and Flooding, Incident Period: June 23, 2006 to July 14, 2006, Major Disaster (Presidential) Declared DR-1654: July 05, 2006, FEMA Id: 1654, Natural disaster type: Storm, Flood
- Delaware Hurricane Katrina Evacuation, Incident Period: August 29, 2005 to October 01, 2005, Emergency Declared EM-3263: September 30, 2005, FEMA Id: 3263, Natural disaster type: Hurricane
- Delaware Hurricane Isabel, Incident Period: September 18, 2003 to September 29, 2003, Major Disaster (Presidential) Declared DR-1494: September 20, 2003, FEMA Id: 1494, Natural disaster type: Hurricane
- 8 other natural disasters have been reported since 1953.
The number of natural disasters in Sussex County (18) is near the US average (15).
Major Disasters (Presidential) Declared: 13
Emergencies Declared: 5
Causes of natural disasters: Hurricanes: 6, Floods: 5, Storms: 3, Winter Storms: 3, Snowstorms: 2, Blizzard: 1, Ice Storm: 1, Snowfall: 1, Water Shortage: 1, Other: 1 (Note: some incidents may be assigned to more than one category).
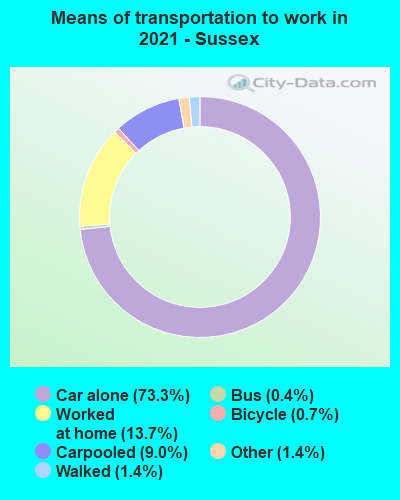
Means of transportation to work:
- Drove a car alone: 72,648 (74.1%)
- Carpooled: 6,611 (6.7%)
- Bus: 211 (0.2%)
- Subway or elevated rail: 37 (0.0%)
- Taxicab, motorcycle, or other means: 1,139 (1.2%)
- Bicycle: 316 (0.3%)
- Walked: 1,846 (1.9%)
- Worked at home: 15,222 (15.5%)

- Health care and social assistance (24%)
- Retail trade (11%)
- Educational services (11%)
- Accommodation and food services (10%)
- Manufacturing (5%)
- Professional, scientific, and technical services (5%)
- Finance and insurance (5%)
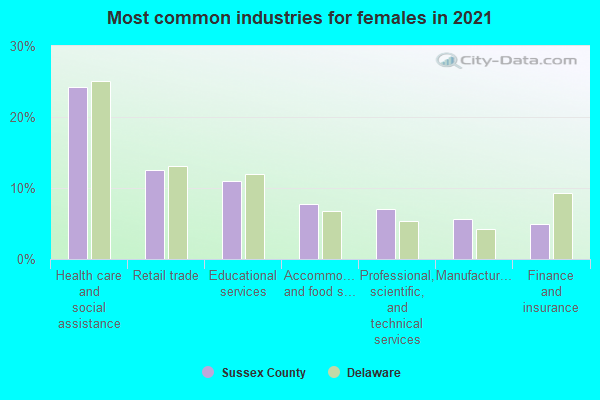
- Health care and social assistance (25%)
- Retail trade (12%)
- Educational services (11%)
- Accommodation and food services (10%)
- Manufacturing (6%)
- Professional, scientific, and technical services (5%)
- Finance and insurance (5%)
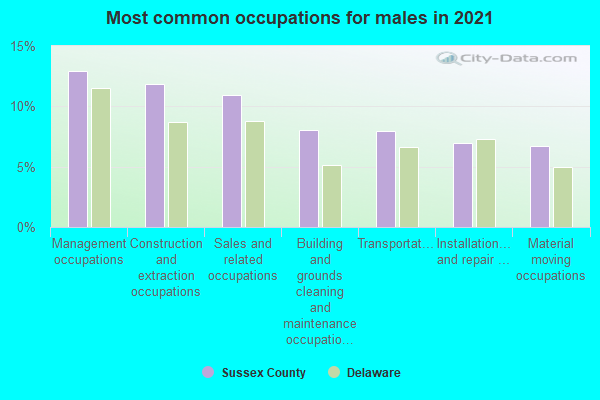
- Construction and extraction occupations (13%)
- Sales and related occupations (12%)
- Management occupations (11%)
- Building and grounds cleaning and maintenance occupations (6%)
- Installation, maintenance, and repair occupations (6%)
- Food preparation and serving related occupations (5%)
- Transportation occupations (5%)
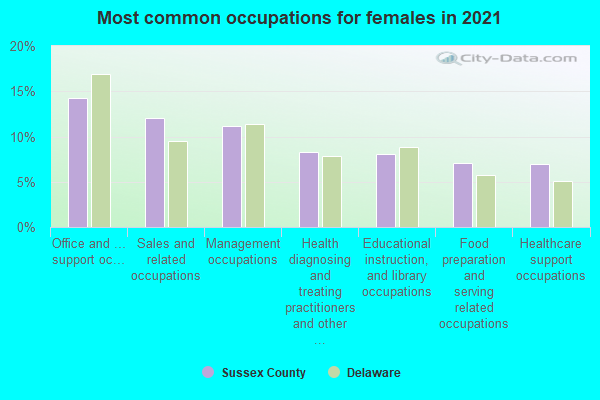
- Office and administrative support occupations (15%)
- Sales and related occupations (12%)
- Management occupations (11%)
- Food preparation and serving related occupations (9%)
- Health diagnosing and treating practitioners and other technical occupations (8%)
- Educational instruction, and library occupations (8%)
- Healthcare support occupations (7%)
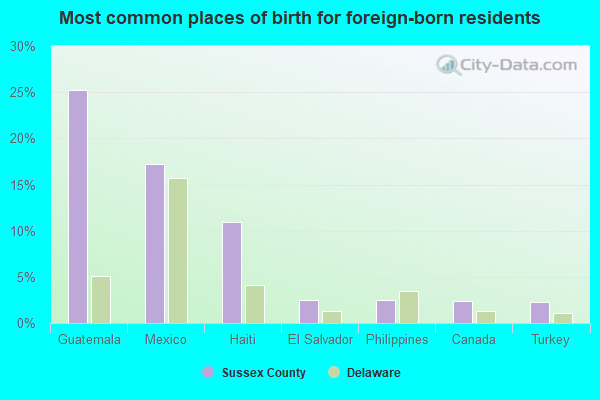
- Guatemala (29%)
- Mexico (15%)
- Haiti (10%)
- Philippines (3%)
- El Salvador (3%)
- Canada (2%)
- Dominican Republic (2%)
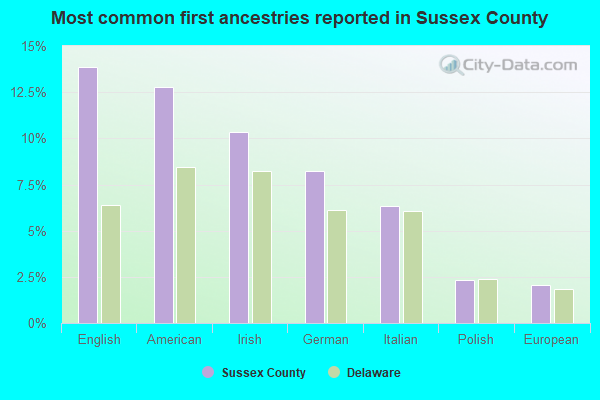
- English (13%)
- American (12%)
- Irish (10%)
- German (8%)
- Italian (7%)
- European (2%)
- Polish (2%)
People in group quarters in Sussex County, Delaware in 2010:
- 1,518 people in correctional residential facilities
- 1,149 people in nursing facilities/skilled-nursing facilities
- 152 people in group homes intended for adults
- 65 people in emergency and transitional shelters (with sleeping facilities) for people experiencing homelessness
- 27 people in other noninstitutional facilities
- 10 people in correctional facilities intended for juveniles
- 8 people in group homes for juveniles (non-correctional)
- 8 people in residential treatment centers for adults
People in group quarters in Sussex County, Delaware in 2000:
- 1,094 people in state prisons
- 1,069 people in nursing homes
- 434 people in local jails and other confinement facilities (including police lockups)
- 337 people in other noninstitutional group quarters
- 258 people in schools, hospitals, or wards for the intellectually disabled
- 99 people in homes for the mentally ill
- 52 people in homes for the mentally retarded
- 30 people in homes or halfway houses for drug/alcohol abuse
- 26 people in other group homes
- 14 people in college dormitories (includes college quarters off campus)
- 9 people in mental (psychiatric) hospitals or wards
- 8 people in religious group quarters
- 5 people in hospitals or wards for drug/alcohol abuse
- 4 people in other nonhousehold living situations
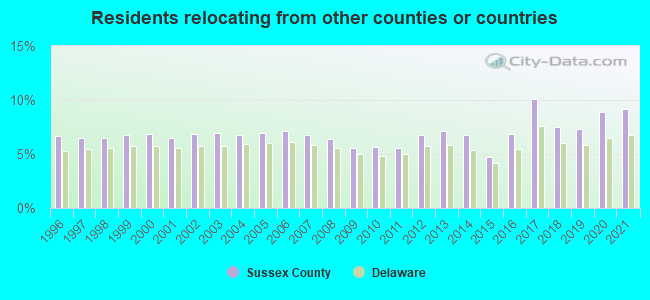
9.20% of this county's 2021 resident taxpayers lived in other counties in 2020 ($115,155 average adjusted gross income)
| Here: | 9.20% |
| Delaware average: | 6.79% |
0.02% of residents moved from foreign countries ($98 average AGI)
Sussex County: 0.02% Delaware average: 0.03%
1.66% relocated from other counties in Delaware ($15,153 average AGI)
7.52% relocated from other states ($99,904 average AGI)
Sussex County: 7.52% Delaware average: 5.52%
Top counties from which taxpayers relocated into this county between 2020 and 2021:
| from Kent County, DE | |
| from New Castle County, DE | |
| from Wicomico County, MD | |
| from Baltimore County, MD | |
| from Montgomery County, MD | |
| from Anne Arundel County, MD | |
| from Chester County, PA |
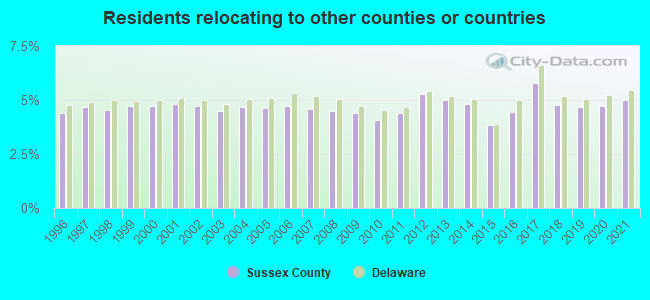
4.99% of this county's 2020 resident taxpayers moved to other counties in 2021 ($78,592 average adjusted gross income)
| Here: | 4.99% |
| Delaware average: | 5.45% |
10 or fewer of this county's residents moved to foreign countries.
1.16% relocated to other counties in Delaware ($12,172 average AGI)
3.83% relocated to other states ($66,420 average AGI)
Sussex County: 3.83% Delaware average: 4.16%
Top counties to which taxpayers relocated from this county between 2020 and 2021:
| to Kent County, DE | |
| to New Castle County, DE | |
| to Wicomico County, MD | |
| to Worcester County, MD | |
| to Anne Arundel County, MD | |
| to Baltimore County, MD | |
| to Montgomery County, MD |
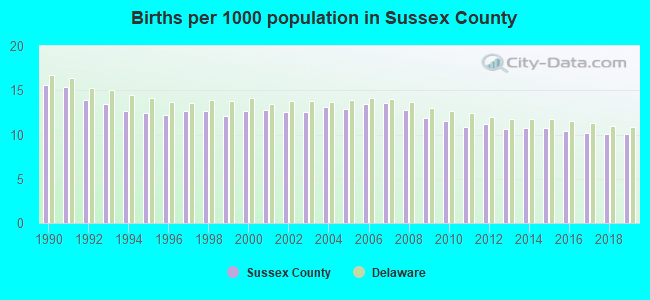
Births per 1000 population from 1990 to 1999: 13.3
Births per 1000 population from 2000 to 2009: 12.8
Births per 1000 population from 2010 to 2022: 8.9
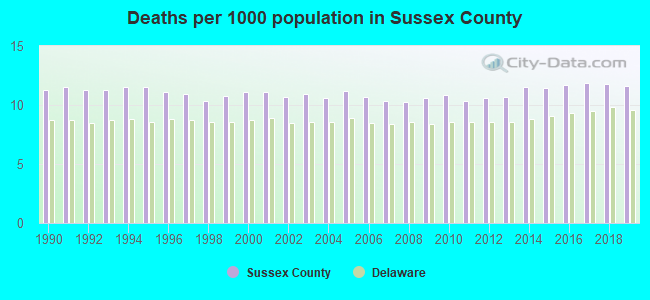
Deaths per 1000 population from 1990 to 1999: 11.1
Deaths per 1000 population from 2000 to 2009: 10.7
Deaths per 1000 population from 2010 to 2020: 11.5
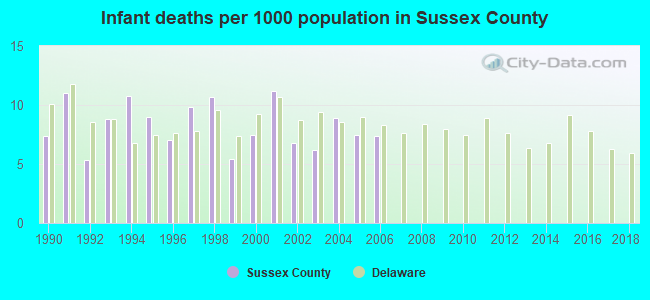
Infant deaths per 1000 live births from 1990 to 1999: 8.5
Infant deaths per 1000 live births from 2000 to 2006: 7.9
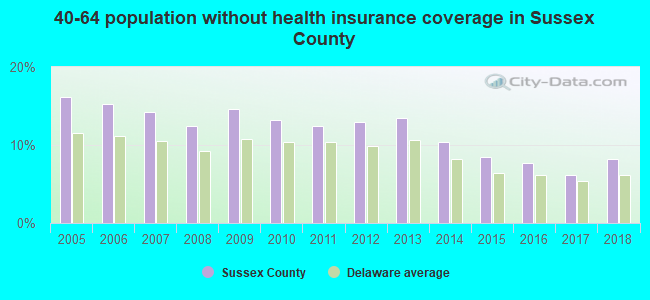
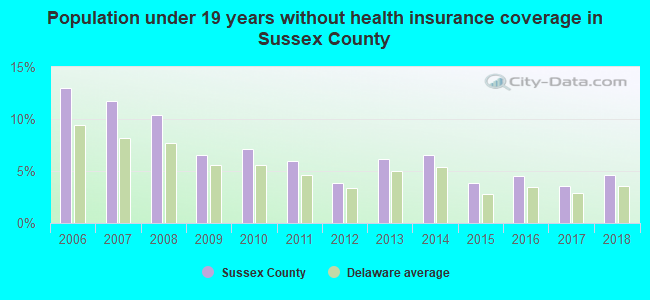
Persons under 19 years old without health insurance coverage in 2018: 4.6%
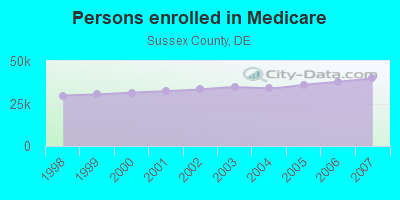
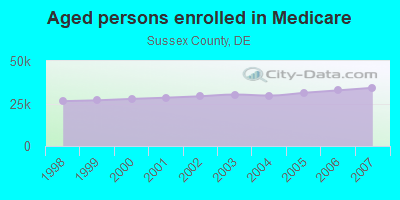
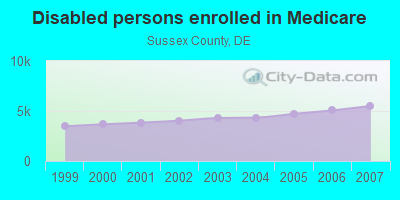
Persons enrolled in hospital insurance and/or supplemental medical insurance (Medicare) in July 1, 2007: 39,725 (34,226 aged, 5,499 disabled)
Children under 18 without health insurance coverage in 2007: 4,894 (12%)
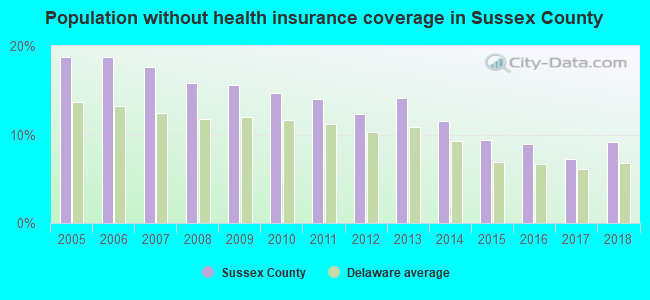
Population without health insurance coverage in 2000: 14%
Children under 18 without health insurance coverage in 2000: 12%
Short term general hospital admissions per 100,000 population in 2004: 9,413
Short term general hospital beds per 100,000 population in 2004: 254
Emergency room visits per 100,000 population in 2004: 35,393
General practice office based MDs per 100,000 population in 2005: 1,289
Medical specialist MDs per 100,000 population in 2005: 1,045
Dentists per 100,000 population in 1998: 32
Total births per 100,000 population, July 2005 - July 2006 : 18
Total deaths per 100,000 population, July 2005 - July 2006: 99
Limited-service eating places per 100,000 population in 2005 : 16
Beer, wine & liquor stores per 100,000 population in 2005: 1
Homicides per 1,000,000 population from 2000 to 2006: 25.5. This is less than state average.
Suicides per 1,000,000 population from 2000 to 2006: 118.2. This is more than state average.
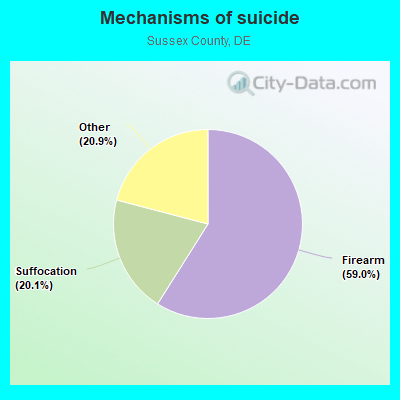
- Firearm - 69.7
- Suffocation - 23.8
- Other - 24.7
Household type by relationship:
Households: 255,956- Male householders: 50,637 (11,043 living alone), Female householders: 54,211 (15,812 living alone)
59,967 spouses (57,136 opposite-sex spouses), 6,206 unmarried partners, (5,710 opposite-sex unmarried partners), 59,012 children (54,747 natural, 1,612 adopted, 2,653 stepchildren), 5,297 grandchildren, 1,634 brothers or sisters, 2,983 parents, 15 foster children, 6,789 other relatives, 6,345 non-relatives
- In group quarters: 2,860
Size of family households: 44,996 2-persons, 11,646 3-persons, 8,938 4-persons, 4,631 5-persons, 1,564 6-persons, 1,133 7-or-more-persons.
Size of nonfamily households: 26,855 1-person, 4,448 2-persons, 416 3-persons, 167 4-persons, 54 6-persons.
27,271 married couples with children.
9,992 single-parent households (2,814 men, 7,178 women).
89.7% of residents of Sussex speak English at home.
7.5% of residents speak Spanish at home (52% speak English very well, 19% speak English well, 20% speak English not well, 8% don't speak English at all).
2.3% of residents speak other Indo-European language at home (65% speak English very well, 21% speak English well, 11% speak English not well, 2% don't speak English at all).
0.8% of residents speak Asian or Pacific Island language at home (58% speak English very well, 20% speak English well, 14% speak English not well, 8% don't speak English at all).
0.3% of residents speak other language at home (67% speak English very well, 20% speak English well, 12% speak English not well, 1% don't speak English at all).
In fiscal year 2004:
Federal Government expenditure: $1,039,258,000 ($6,035 per capita)
Department of Defense expenditure: $45,263,000
Federal direct payments to individuals for retirement and disability: $580,493,000
Federal other direct payments to individuals: $212,548,000
Federal direct payments not to individuals: $7,249,000
Federal grants: $181,258,000
Federal procurement contracts: $14,397,000 ($6,589,000 Department of Defense)
Federal salaries and wages: $43,313,000 ($13,118,000 Department of Defense)
Federal Government direct loans: $12,204,000
Federal guaranteed/insured loans: $63,134,000
Federal Government insurance: $2,692,820,000
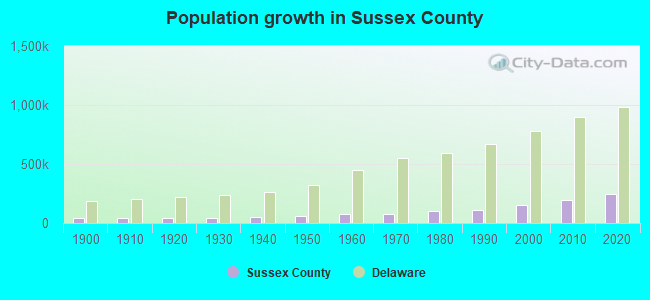
Population change from April 1, 2000 to July 1, 2005:
Births: 10,889| Here: | 62 per 1000 residents |
| State: | 70 per 1000 residents |
Deaths: 9,431
| Here: | 53 per 1000 residents |
| State: | 44 per 1000 residents |
Net international migration: +1,867
| Here: | +11 per 1000 residents |
| State: | +13 per 1000 residents |
Net internal migration: +16,923
| Here: | +96 per 1000 residents |
| State: | +33 per 1000 residents |
Total withdrawal of fresh water for public supply: 12.60 millions of gallons per day (all from ground)
| Here: | 6.6 |
| State: | 6.9 |
| Here: | 4.9 |
| State: | 4.4 |
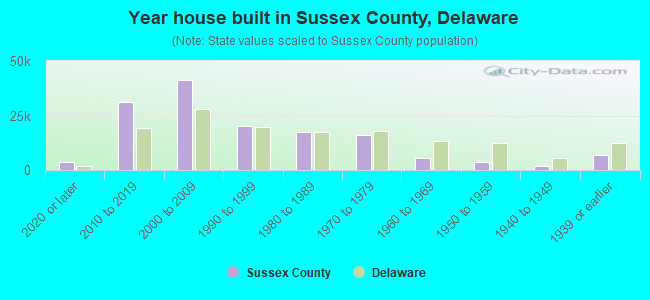
- Year house built in Sussex County, Delaware
- 9,4052020 or later
- 35,6292010 to 2019
- 37,5102000 to 2009
- 21,3251990 to 1999
- 16,7561980 to 1989
- 13,8831970 to 1979
- 6,0981960 to 1969
- 3,8751950 to 1959
- 2,6251940 to 1949
- 5,1631939 or earlier
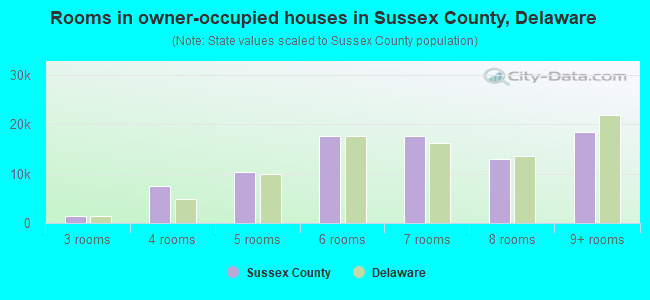
- Rooms in owner-occupied houses in Sussex County, Delaware
- 1721 room
- 1622 rooms
- 7413 rooms
- 7,4374 rooms
- 15,2685 rooms
- 17,8596 rooms
- 16,5157 rooms
- 12,0088 rooms
- 17,2049+ rooms
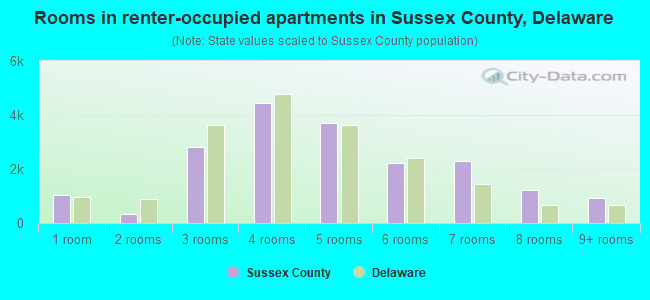
- Rooms in renter-occupied apartments in Sussex County, Delaware
- 4371 room
- 6962 rooms
- 2,0873 rooms
- 4,0234 rooms
- 3,6535 rooms
- 2,8926 rooms
- 1,8007 rooms
- 1,2598 rooms
- 6359+ rooms
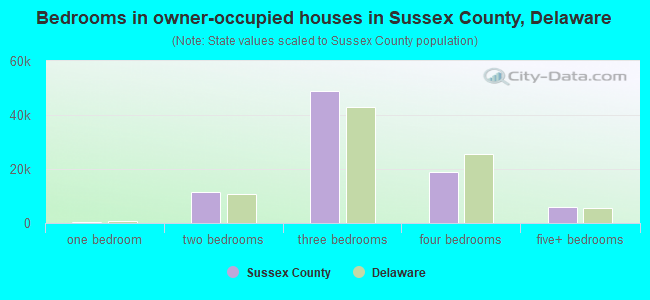
- Bedrooms in owner-occupied houses in Sussex County, Delaware
- 253no bedroom
- 7541 bedroom
- 9,0732 bedrooms
- 54,1503 bedrooms
- 19,0664 bedrooms
- 4,0705+ bedrooms
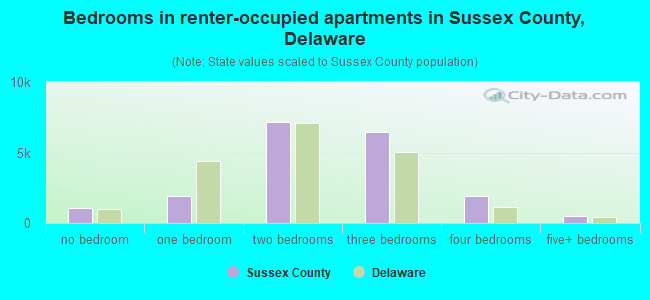
- Bedrooms in renter-occupied apartments in Sussex County, Delaware
- 457no bedroom
- 2,5141 bedroom
- 5,9522 bedrooms
- 6,8183 bedrooms
- 1,4004 bedrooms
- 3415+ bedrooms
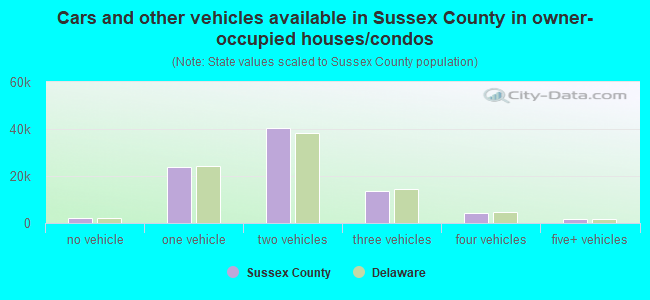
- Cars and other vehicles available in Sussex County in owner-occupied houses/condos
- 1,714no vehicle
- 24,8481 vehicle
- 39,3982 vehicles
- 15,0963 vehicles
- 4,7704 vehicles
- 1,5405+ vehicles
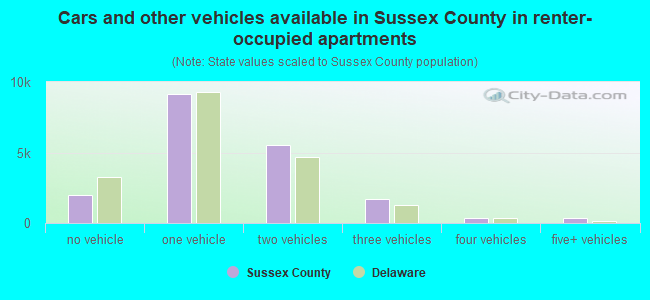
- Cars and other vehicles available in Sussex County in renter-occupied apartments
- 2,359no vehicle
- 7,6301 vehicle
- 5,2282 vehicles
- 1,8473 vehicles
- 2754 vehicles
- 1435+ vehicles
89.7% of Sussex County residents lived in the same house 1 years ago.
Out of people who lived in different houses, 23% lived in this county.
Out of people who lived in different counties, 15% lived in Delaware.
| Sussex County: | 89.7% |
| State average: | 89.2% |
Place of birth for U.S.-born residents:
- This state: 86,567
- Other state: 148,731
- Northeast: 72,075
- Midwest: 7,425
- South: 63,962
- West: 5,269
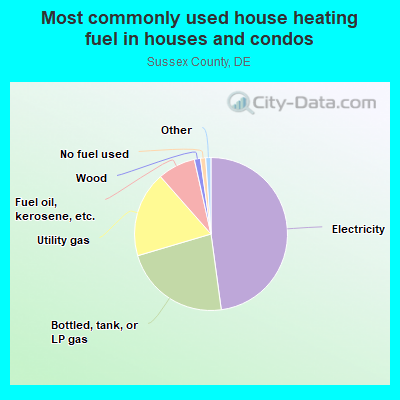
- 48.2%Electricity
- 22.2%Bottled, tank, or LP gas
- 20.6%Utility gas
- 6.1%Fuel oil, kerosene, etc.
- 1.1%Other fuel
- 0.8%Wood
- 0.7%Solar energy
- 0.3%No fuel used
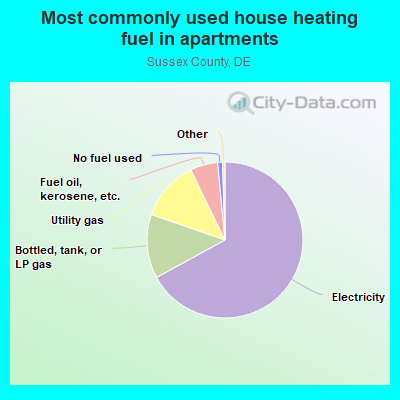
- 61.5%Electricity
- 18.7%Utility gas
- 12.9%Bottled, tank, or LP gas
- 4.5%Fuel oil, kerosene, etc.
- 1.8%Wood
- 0.4%No fuel used
- 0.3%Solar energy
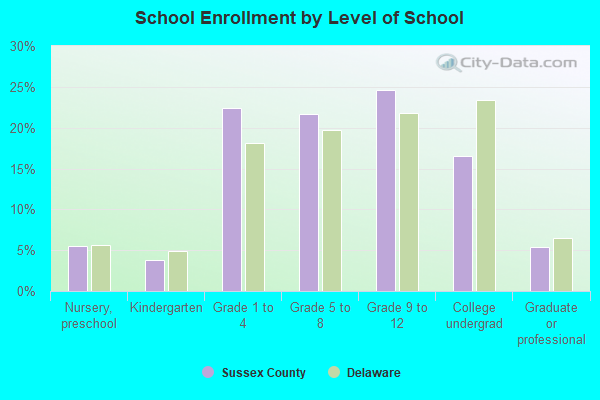
Private vs. public school enrollment:
| Here: | 12.0% |
| Delaware: | 11.5% |
| Here: | 7.1% |
| Delaware: | 12.1% |
| Here: | 21.8% |
| Delaware: | 19.2% |
Sussex County government finances - Expenditure in 2020:
- Charges - Sewerage: $24,985,000
Sewerage: $23,666,000
Other: $13,454,000
Other: $12,886,000
Air Transportation: $671,000
Air Transportation: $555,000
- Construction - Sewerage: $43,691,000
Sewerage: $28,359,000
General - Other: $7,282,000
General - Other: $4,664,000
General Public Buildings: $185,000
Solid Waste Management: $100,000
- Current Operations - Sewerage: $19,630,000
Sewerage: $17,724,000
Health - Other: $16,366,000
Health - Other: $15,465,000
General - Other: $6,286,000
Central Staff Services: $5,664,000
Libraries: $5,591,000
Central Staff Services: $5,260,000
Libraries: $5,217,000
Local Fire Protection: $4,694,000
Police Protection: $4,660,000
Local Fire Protection: $4,061,000
Police Protection: $4,003,000
General - Other: $3,994,000
Financial Administration: $3,946,000
Financial Administration: $3,570,000
Public Welfare - Other: $2,393,000
Housing and Community Development: $1,919,000
General Public Buildings: $1,768,000
Regular Highways: $1,758,000
Housing and Community Development: $1,727,000
General Public Buildings: $1,701,000
Protective Inspection and Regulation - Other: $1,662,000
Water Utilities: $1,190,000
Water Utilities: $1,024,000
Public Welfare - Other: $977,000
Air Transportation: $916,000
Protective Inspection and Regulation - Other: $845,000
Air Transportation: $764,000
Judicial and Legal Services: $460,000
Judicial and Legal Services: $395,000
- Federal Intergovernmental - Air Transportation: $3,893,000
Housing and Community Development: $1,570,000
Air Transportation: $504,000
Other: $344,000
Other: $249,000
Water Utilities: $162,000
General Local Government Support: $7,000
General Local Government Support: $5,000
- General - Interest on Debt: $4,297,000
Interest on Debt: $4,116,000
- Long Term Debt - Outstanding Unspecified Public Purpose: $146,040,000
Beginning Outstanding - Unspecified Public Purpose: $145,053,000
Beginning Outstanding - Unspecified Public Purpose: $142,189,000
Outstanding Unspecified Public Purpose: $141,864,000
Issue, Unspecified Public Purpose: $12,635,000
Retired Unspecified Public Purpose: $8,784,000
Retired Unspecified Public Purpose: $6,822,000
Issue, Unspecified Public Purpose: $3,633,000
- Miscellaneous - Special Assessments: $25,354,000
Special Assessments: $22,836,000
General Revenue - Other: $14,628,000
Interest Earnings: $5,496,000
Interest Earnings: $2,030,000
General Revenue - Other: $235,000
Sale of Property: $126,000
Fines and Forfeits: $44,000
Fines and Forfeits: $43,000
Sale of Property: $27,000
- Other Capital Outlay - Water Utilities: $116,000
- Other Funds - Cash and Securities: $235,453,000
Cash and Securities: $216,818,000
- Revenue - Water Utilities: $1,275,000
Water Utilities: $1,239,000
- State Intergovernmental - Other: $5,075,000
Health and Hospitals: $4,052,000
Housing and Community Development: $1,554,000
Other: $382,000
- Tax - Property: $54,100,000
Documentary and Stock Transfer: $35,478,000
Documentary and Stock Transfer: $32,300,000
Property: $17,405,000
Other License: $2,365,000
Other License: $2,276,000
- Total Salaries and Wages: $26,070,000
: $14,293,000
Sussex County government finances - Revenue in 2020:
- Charges - Sewerage: $24,985,000
Sewerage: $23,666,000
Other: $13,454,000
Other: $12,886,000
Air Transportation: $671,000
Air Transportation: $555,000
- Construction - Sewerage: $43,691,000
Sewerage: $28,359,000
General - Other: $7,282,000
General - Other: $4,664,000
General Public Buildings: $185,000
Solid Waste Management: $100,000
- Current Operations - Sewerage: $19,630,000
Sewerage: $17,724,000
Health - Other: $16,366,000
Health - Other: $15,465,000
General - Other: $6,286,000
Central Staff Services: $5,664,000
Libraries: $5,591,000
Central Staff Services: $5,260,000
Libraries: $5,217,000
Local Fire Protection: $4,694,000
Police Protection: $4,660,000
Local Fire Protection: $4,061,000
Police Protection: $4,003,000
General - Other: $3,994,000
Financial Administration: $3,946,000
Financial Administration: $3,570,000
Public Welfare - Other: $2,393,000
Housing and Community Development: $1,919,000
General Public Buildings: $1,768,000
Regular Highways: $1,758,000
Housing and Community Development: $1,727,000
General Public Buildings: $1,701,000
Protective Inspection and Regulation - Other: $1,662,000
Water Utilities: $1,190,000
Water Utilities: $1,024,000
Public Welfare - Other: $977,000
Air Transportation: $916,000
Protective Inspection and Regulation - Other: $845,000
Air Transportation: $764,000
Judicial and Legal Services: $460,000
Judicial and Legal Services: $395,000
- Federal Intergovernmental - Air Transportation: $3,893,000
Housing and Community Development: $1,570,000
Air Transportation: $504,000
Other: $344,000
Other: $249,000
Water Utilities: $162,000
General Local Government Support: $7,000
General Local Government Support: $5,000
- General - Interest on Debt: $4,297,000
Interest on Debt: $4,116,000
- Long Term Debt - Outstanding Unspecified Public Purpose: $146,040,000
Beginning Outstanding - Unspecified Public Purpose: $145,053,000
Beginning Outstanding - Unspecified Public Purpose: $142,189,000
Outstanding Unspecified Public Purpose: $141,864,000
Issue, Unspecified Public Purpose: $12,635,000
Retired Unspecified Public Purpose: $8,784,000
Retired Unspecified Public Purpose: $6,822,000
Issue, Unspecified Public Purpose: $3,633,000
- Miscellaneous - Special Assessments: $25,354,000
Special Assessments: $22,836,000
General Revenue - Other: $14,628,000
Interest Earnings: $5,496,000
Interest Earnings: $2,030,000
General Revenue - Other: $235,000
Sale of Property: $126,000
Fines and Forfeits: $44,000
Fines and Forfeits: $43,000
Sale of Property: $27,000
- Other Capital Outlay - Water Utilities: $116,000
- Other Funds - Cash and Securities: $235,453,000
Cash and Securities: $216,818,000
- Revenue - Water Utilities: $1,275,000
Water Utilities: $1,239,000
- State Intergovernmental - Other: $5,075,000
Health and Hospitals: $4,052,000
Housing and Community Development: $1,554,000
Other: $382,000
- Tax - Property: $54,100,000
Documentary and Stock Transfer: $35,478,000
Documentary and Stock Transfer: $32,300,000
Property: $17,405,000
Other License: $2,365,000
Other License: $2,276,000
- Total Salaries and Wages: $26,070,000
: $14,293,000
Sussex County government finances - Debt in 2020:
- Charges - Sewerage: $24,985,000
Sewerage: $23,666,000
Other: $13,454,000
Other: $12,886,000
Air Transportation: $671,000
Air Transportation: $555,000
- Construction - Sewerage: $43,691,000
Sewerage: $28,359,000
General - Other: $7,282,000
General - Other: $4,664,000
General Public Buildings: $185,000
Solid Waste Management: $100,000
- Current Operations - Sewerage: $19,630,000
Sewerage: $17,724,000
Health - Other: $16,366,000
Health - Other: $15,465,000
General - Other: $6,286,000
Central Staff Services: $5,664,000
Libraries: $5,591,000
Central Staff Services: $5,260,000
Libraries: $5,217,000
Local Fire Protection: $4,694,000
Police Protection: $4,660,000
Local Fire Protection: $4,061,000
Police Protection: $4,003,000
General - Other: $3,994,000
Financial Administration: $3,946,000
Financial Administration: $3,570,000
Public Welfare - Other: $2,393,000
Housing and Community Development: $1,919,000
General Public Buildings: $1,768,000
Regular Highways: $1,758,000
Housing and Community Development: $1,727,000
General Public Buildings: $1,701,000
Protective Inspection and Regulation - Other: $1,662,000
Water Utilities: $1,190,000
Water Utilities: $1,024,000
Public Welfare - Other: $977,000
Air Transportation: $916,000
Protective Inspection and Regulation - Other: $845,000
Air Transportation: $764,000
Judicial and Legal Services: $460,000
Judicial and Legal Services: $395,000
- Federal Intergovernmental - Air Transportation: $3,893,000
Housing and Community Development: $1,570,000
Air Transportation: $504,000
Other: $344,000
Other: $249,000
Water Utilities: $162,000
General Local Government Support: $7,000
General Local Government Support: $5,000
- General - Interest on Debt: $4,297,000
Interest on Debt: $4,116,000
- Long Term Debt - Outstanding Unspecified Public Purpose: $146,040,000
Beginning Outstanding - Unspecified Public Purpose: $145,053,000
Beginning Outstanding - Unspecified Public Purpose: $142,189,000
Outstanding Unspecified Public Purpose: $141,864,000
Issue, Unspecified Public Purpose: $12,635,000
Retired Unspecified Public Purpose: $8,784,000
Retired Unspecified Public Purpose: $6,822,000
Issue, Unspecified Public Purpose: $3,633,000
- Miscellaneous - Special Assessments: $25,354,000
Special Assessments: $22,836,000
General Revenue - Other: $14,628,000
Interest Earnings: $5,496,000
Interest Earnings: $2,030,000
General Revenue - Other: $235,000
Sale of Property: $126,000
Fines and Forfeits: $44,000
Fines and Forfeits: $43,000
Sale of Property: $27,000
- Other Capital Outlay - Water Utilities: $116,000
- Other Funds - Cash and Securities: $235,453,000
Cash and Securities: $216,818,000
- Revenue - Water Utilities: $1,275,000
Water Utilities: $1,239,000
- State Intergovernmental - Other: $5,075,000
Health and Hospitals: $4,052,000
Housing and Community Development: $1,554,000
Other: $382,000
- Tax - Property: $54,100,000
Documentary and Stock Transfer: $35,478,000
Documentary and Stock Transfer: $32,300,000
Property: $17,405,000
Other License: $2,365,000
Other License: $2,276,000
- Total Salaries and Wages: $26,070,000
: $14,293,000
Sussex County government finances - Cash and Securities in 2020:
- Charges - Sewerage: $24,985,000
Sewerage: $23,666,000
Other: $13,454,000
Other: $12,886,000
Air Transportation: $671,000
Air Transportation: $555,000
- Construction - Sewerage: $43,691,000
Sewerage: $28,359,000
General - Other: $7,282,000
General - Other: $4,664,000
General Public Buildings: $185,000
Solid Waste Management: $100,000
- Current Operations - Sewerage: $19,630,000
Sewerage: $17,724,000
Health - Other: $16,366,000
Health - Other: $15,465,000
General - Other: $6,286,000
Central Staff Services: $5,664,000
Libraries: $5,591,000
Central Staff Services: $5,260,000
Libraries: $5,217,000
Local Fire Protection: $4,694,000
Police Protection: $4,660,000
Local Fire Protection: $4,061,000
Police Protection: $4,003,000
General - Other: $3,994,000
Financial Administration: $3,946,000
Financial Administration: $3,570,000
Public Welfare - Other: $2,393,000
Housing and Community Development: $1,919,000
General Public Buildings: $1,768,000
Regular Highways: $1,758,000
Housing and Community Development: $1,727,000
General Public Buildings: $1,701,000
Protective Inspection and Regulation - Other: $1,662,000
Water Utilities: $1,190,000
Water Utilities: $1,024,000
Public Welfare - Other: $977,000
Air Transportation: $916,000
Protective Inspection and Regulation - Other: $845,000
Air Transportation: $764,000
Judicial and Legal Services: $460,000
Judicial and Legal Services: $395,000
- Federal Intergovernmental - Air Transportation: $3,893,000
Housing and Community Development: $1,570,000
Air Transportation: $504,000
Other: $344,000
Other: $249,000
Water Utilities: $162,000
General Local Government Support: $7,000
General Local Government Support: $5,000
- General - Interest on Debt: $4,297,000
Interest on Debt: $4,116,000
- Long Term Debt - Outstanding Unspecified Public Purpose: $146,040,000
Beginning Outstanding - Unspecified Public Purpose: $145,053,000
Beginning Outstanding - Unspecified Public Purpose: $142,189,000
Outstanding Unspecified Public Purpose: $141,864,000
Issue, Unspecified Public Purpose: $12,635,000
Retired Unspecified Public Purpose: $8,784,000
Retired Unspecified Public Purpose: $6,822,000
Issue, Unspecified Public Purpose: $3,633,000
- Miscellaneous - Special Assessments: $25,354,000
Special Assessments: $22,836,000
General Revenue - Other: $14,628,000
Interest Earnings: $5,496,000
Interest Earnings: $2,030,000
General Revenue - Other: $235,000
Sale of Property: $126,000
Fines and Forfeits: $44,000
Fines and Forfeits: $43,000
Sale of Property: $27,000
- Other Capital Outlay - Water Utilities: $116,000
- Other Funds - Cash and Securities: $235,453,000
Cash and Securities: $216,818,000
- Revenue - Water Utilities: $1,275,000
Water Utilities: $1,239,000
- State Intergovernmental - Other: $5,075,000
Health and Hospitals: $4,052,000
Housing and Community Development: $1,554,000
Other: $382,000
- Tax - Property: $54,100,000
Documentary and Stock Transfer: $35,478,000
Documentary and Stock Transfer: $32,300,000
Property: $17,405,000
Other License: $2,365,000
Other License: $2,276,000
- Total Salaries and Wages: $26,070,000
: $14,293,000
Supplemental Security Income (SSI) in 2006:
- Total number of recipients: 2,641
- Number of aged recipients: 236
- Number of blind and disabled recipients: 2,405
- Number of recipients under 18: 553
- Number of recipients between 18 and 64: 1,608
- Number of recipients older than 64: 480
- Number of recipients also receiving OASDI: 944
- Amount of payments (thousands of dollars): 1,121
| Most common first names in Sussex County, DE among deceased individuals | ||
| Name | Count | Lived (average) |
|---|---|---|
| William | 1,502 | 74.1 years |
| John | 1,477 | 73.7 years |
| Mary | 1,176 | 79.4 years |
| James | 931 | 72.2 years |
| Robert | 850 | 71.4 years |
| Charles | 838 | 74.5 years |
| George | 808 | 75.0 years |
| Joseph | 580 | 74.3 years |
| Helen | 550 | 79.7 years |
| Margaret | 533 | 78.8 years |
| Most common last names in Sussex County, DE among deceased individuals | ||
| Last name | Count | Lived (average) |
|---|---|---|
| Smith | 536 | 75.3 years |
| Johnson | 388 | 75.4 years |
| Jones | 359 | 73.8 years |
| Hudson | 339 | 76.7 years |
| Moore | 268 | 75.5 years |
| Williams | 264 | 74.6 years |
| Wilson | 245 | 76.1 years |
| Brown | 232 | 73.6 years |
| Mitchell | 221 | 76.1 years |
| Hastings | 217 | 75.4 years |
| Businesses in Sussex County, DE | ||||
| Name | Count | Name | Count | |
|---|---|---|---|---|
| 7-Eleven | 1 | Jones New York | 3 | |
| AT&T | 8 | Journeys | 1 | |
| Ace Hardware | 5 | Justice | 1 | |
| Advance Auto Parts | 6 | KFC | 3 | |
| Aeropostale | 2 | Kincaid | 1 | |
| AmericInn | 2 | Kmart | 1 | |
| American Eagle Outfitters | 2 | La-Z-Boy | 4 | |
| Ann Taylor | 2 | Lane Bryant | 1 | |
| Applebee's | 3 | Lane Furniture | 2 | |
| Arby's | 6 | Levi Strauss & Co. | 1 | |
| Ascend Collection | 1 | Little Caesars Pizza | 2 | |
| Ashley Furniture | 1 | Lowe's | 3 | |
| AutoZone | 3 | Marshalls | 1 | |
| BMW | 1 | MasterBrand Cabinets | 57 | |
| Banana Republic | 1 | McDonald's | 10 | |
| Baskin-Robbins | 5 | Motherhood Maternity | 1 | |
| Best Western | 1 | New Balance | 3 | |
| Blockbuster | 1 | Nike | 3 | |
| Brooks Brothers | 1 | Old Navy | 1 | |
| Budget Car Rental | 1 | Outback | 1 | |
| Burger King | 4 | Outback Steakhouse | 1 | |
| CVS | 2 | Pac Sun | 1 | |
| Casual Male XL | 1 | Papa John's Pizza | 1 | |
| Charlotte Russe | 1 | Penske | 2 | |
| Chevrolet | 4 | Pier 1 Imports | 1 | |
| Chico's | 1 | Pizza Hut | 2 | |
| Clarks | 1 | Popeyes | 2 | |
| Cold Stone Creamery | 2 | Quality | 2 | |
| Coldwater Creek | 1 | Quiznos | 2 | |
| Comfort Inn | 2 | RadioShack | 4 | |
| Comfort Suites | 1 | Rite Aid | 11 | |
| Cracker Barrel | 1 | Rodeway Inn | 1 | |
| Curves | 4 | Ruby Tuesday | 2 | |
| DHL | 4 | Rue21 | 1 | |
| Dairy Queen | 7 | SONIC Drive-In | 2 | |
| Days Inn | 1 | Safeway | 1 | |
| Decora Cabinetry | 2 | Sears | 4 | |
| Domino's Pizza | 7 | Skechers USA | 1 | |
| DressBarn | 1 | Sleep Inn | 1 | |
| Dressbarn | 1 | Soma Intimates | 1 | |
| Dunkin Donuts | 7 | Sprint Nextel | 1 | |
| Econo Lodge | 1 | Staples | 1 | |
| Eddie Bauer | 1 | Starbucks | 5 | |
| Express | 1 | Subway | 15 | |
| Famous Footwear | 1 | Super 8 | 1 | |
| Fashion Bug | 2 | Superfresh | 1 | |
| FedEx | 23 | T-Mobile | 7 | |
| Ford | 3 | T.G.I. Driday's | 1 | |
| GNC | 5 | Taco Bell | 4 | |
| GameStop | 3 | Talbots | 1 | |
| Gap | 1 | Toyota | 1 | |
| Giant | 3 | True Value | 1 | |
| Goodwill | 3 | U-Haul | 10 | |
| Gymboree | 1 | UPS | 26 | |
| H&R Block | 8 | Vans | 2 | |
| Hardee's | 5 | Verizon Wireless | 1 | |
| Hilton | 2 | Vons | 1 | |
| Holiday Inn | 3 | Walgreens | 15 | |
| Home Depot | 1 | Walmart | 4 | |
| IHOP | 2 | Wendy's | 3 | |
| IZOD | 1 | World Gym | 2 | |
| J.Crew | 1 | YMCA | 1 | |
Sussex County on our top lists:
- #9 on the list of "Top 101 counties with the highest percentage of residents that smoked 100+ cigarettes in their lives"
- #9 on the list of "Top 101 counties with the largest number of people moving in compared to moving out (pop. 50,000+)"
- #30 on the list of "Top 101 counties with the highest average weight of females"
- #47 on the list of "Top 101 counties with the lowest Sulfur Oxides Annual air pollution readings in 2012 (µg/m3)"
- #64 on the list of "Top 101 counties with the lowest Nitrogen Dioxide air pollution readings in 2012 (ppm)"
- #65 on the list of "Top 101 counties with the highest percentage of residents that keep firearms around their homes"
- #66 on the list of "Top 101 counties with the lowest percentage of residents that drank alcohol in the past 30 days"
- #96 on the list of "Top 101 counties with the lowest percentage of residents relocating to other counties in 2011 (pop. 50,000+)"