Crime rate in Tyler, Texas (TX): murders, rapes, robberies, assaults, burglaries, thefts, auto thefts, arson, law enforcement employees, police officers, crime map
Crime rate in Tyler, TX
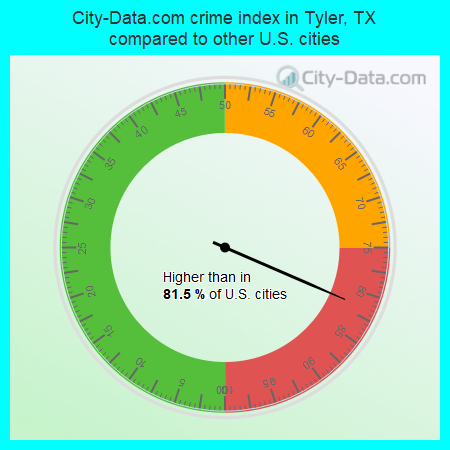
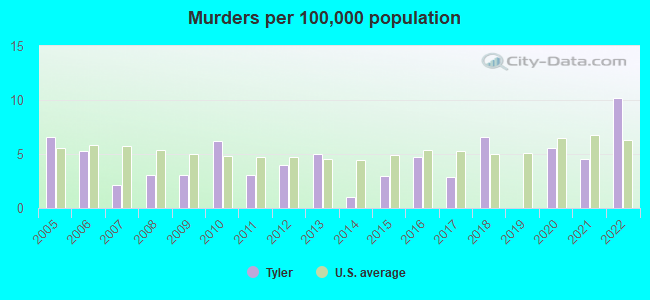
The 2022 crime rate in Tyler, TX is 285 (City-Data.com crime index), which is about the average for the U.S. cities. It was higher than in 86.2% U.S. cities. The 2022 Tyler crime rate rose by 12% compared to 2021. The number of homicides stood at 11 - an increase of 6 compared to 2021. In the last 5 years Tyler has seen rise of violent crime and decline of property crime.See how dangerous Tyler, TX is compared to the nearest cities:
(Note: Higher means more crime)
(Note: Higher means more crime)
| Tyler: | 284.9 |
| Whitehouse: | 93.2 |
| Chandler: | 56.7 |
| Bullard: | 52.2 |
| Lindale: | 123.7 |
| Arp: | 67.2 |
| Troup: | 204.6 |
| Coffee City: | 369.9 |
| Brownsboro: | 65.5 |
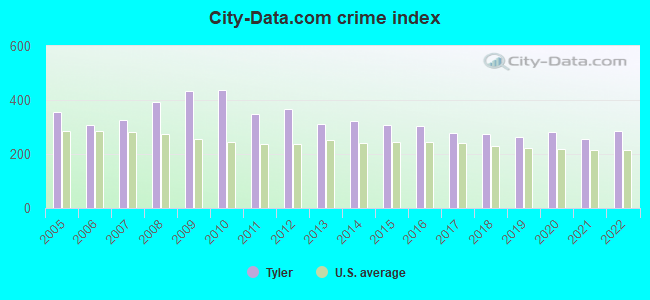
The City-Data.com crime index weighs serious crimes and violent crimes more heavily. Higher means more crime, U.S. average is 246.1. It adjusts for the number of visitors and daily workers commuting into cities.
- means the value is smaller than the state average.- means the value is about the same as the state average.
- means the value is bigger than the state average.
- means the value is much bigger than the state average.
According to our research of Texas and other state lists, there were 447 registered sex offenders living in Tyler, Texas as of June 02, 2024.
The ratio of all residents to sex offenders in Tyler is 234 to 1.
Violent crime rate in 2022
| Tyler: | 320.5 |
| U.S. Average: | 219.8 |
Violent crime rate in 2021
| Tyler: | 254.6 |
| U.S. Average: | 224.8 |
Violent crime rate in 2020
| Tyler: | 254.3 |
| U.S. Average: | 228.2 |
Violent crime rate in 2019
| Tyler: | 225.5 |
| U.S. Average: | 219.9 |
Violent crime rate in 2018
| Tyler: | 240.7 |
| U.S. Average: | 221.2 |
Violent crime rate in 2017
| Tyler: | 252.6 |
| U.S. Average: | 226.2 |
Violent crime rate in 2016
| Tyler: | 243.2 |
| U.S. Average: | 227.3 |
Violent crime rate in 2015
| Tyler: | 223.0 |
| U.S. Average: | 219.3 |
Violent crime rate in 2014
| Tyler: | 257.5 |
| U.S. Average: | 211.1 |
Violent crime rate in 2013
| Tyler: | 216.9 |
| U.S. Average: | 214.2 |
Violent crime rate in 2012
| Tyler: | 297.4 |
| U.S. Average: | 187.4 |
Violent crime rate in 2011
| Tyler: | 274.9 |
| U.S. Average: | 187.1 |
Violent crime rate in 2010
| Tyler: | 370.5 |
| U.S. Average: | 195.7 |
Violent crime rate in 2009
| Tyler: | 299.2 |
| U.S. Average: | 208.9 |
Violent crime rate in 2008
| Tyler: | 352.9 |
| U.S. Average: | 222.5 |
Violent crime rate in 2007
| Tyler: | 302.4 |
| U.S. Average: | 229.1 |
Violent crime rate in 2006
| Tyler: | 263.2 |
| U.S. Average: | 232.6 |
Violent crime rate in 2005
| Tyler: | 284.5 |
| U.S. Average: | 227.0 |
Property crime rate in 2022
| Tyler: | 173.7 |
| U.S. Average: | 166.5 |
Property crime rate in 2021
| Tyler: | 195.0 |
| U.S. Average: | 157.8 |
Property crime rate in 2020
| Tyler: | 243.9 |
| U.S. Average: | 169.6 |
Property crime rate in 2019
| Tyler: | 228.3 |
| U.S. Average: | 179.7 |
Property crime rate in 2018
| Tyler: | 216.9 |
| U.S. Average: | 190.2 |
Property crime rate in 2017
| Tyler: | 234.4 |
| U.S. Average: | 206.4 |
Property crime rate in 2016
| Tyler: | 282.3 |
| U.S. Average: | 216.6 |
Property crime rate in 2015
| Tyler: | 318.8 |
| U.S. Average: | 221.5 |
Property crime rate in 2014
| Tyler: | 315.9 |
| U.S. Average: | 230.8 |
Property crime rate in 2013
| Tyler: | 347.4 |
| U.S. Average: | 250.4 |
Property crime rate in 2012
| Tyler: | 392.0 |
| U.S. Average: | 267.3 |
Property crime rate in 2011
| Tyler: | 368.0 |
| U.S. Average: | 273.5 |
Property crime rate in 2010
| Tyler: | 451.8 |
| U.S. Average: | 276.4 |
Property crime rate in 2009
| Tyler: | 478.2 |
| U.S. Average: | 285.6 |
Property crime rate in 2008
| Tyler: | 366.5 |
| U.S. Average: | 302.2 |
Property crime rate in 2007
| Tyler: | 298.7 |
| U.S. Average: | 309.2 |
Property crime rate in 2006
| Tyler: | 307.1 |
| U.S. Average: | 317.3 |
Property crime rate in 2005
| Tyler: | 374.5 |
| U.S. Average: | 322.3 |


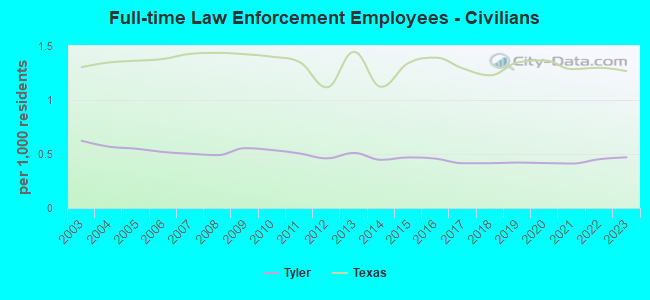
Full-time law enforcement employees in 2021, including police officers: 236 (191 officers - 175 male; 16 female).
| Officers per 1,000 residents here: | 1.75 |
| Texas average: | 2.07 |
Full-time law enforcement employees in 2020, including police officers: 230 (185 officers - 170 male; 15 female).
| Officers per 1,000 residents here: | 1.71 |
| Texas average: | 2.05 |
Full-time law enforcement employees in 2019, including police officers: 238 (193 officers - 178 male; 15 female).
| Officers per 1,000 residents here: | 1.81 |
| Texas average: | 2.02 |
Full-time law enforcement employees in 2017, including police officers: 231 (187 officers - 170 male; 17 female).
| Officers per 1,000 residents here: | 1.76 |
| Texas average: | 2.06 |
Full-time law enforcement employees in 2016, including police officers: 238 (190 officers - 177 male; 13 female).
| Officers per 1,000 residents here: | 1.81 |
| Texas average: | 2.11 |
Full-time law enforcement employees in 2015, including police officers: 234 (186 officers - 171 male; 15 female).
| Officers per 1,000 residents here: | 1.81 |
| Texas average: | 2.13 |
Full-time law enforcement employees in 2014, including police officers: 235 (190 officers - 173 male; 17 female).
| Officers per 1,000 residents here: | 1.88 |
| Texas average: | 2.01 |
Full-time law enforcement employees in 2013, including police officers: 242 (191 officers - 174 male; 17 female).
| Officers per 1,000 residents here: | 1.91 |
| Texas average: | 2.05 |
Full-time law enforcement employees in 2012, including police officers: 234 (188 officers - 171 male; 17 female).
| Officers per 1,000 residents here: | 1.88 |
| Texas average: | 1.95 |
Full-time law enforcement employees in 2011, including police officers: 240 (190 officers - 172 male; 18 female).
| Officers per 1,000 residents here: | 1.92 |
| Texas average: | 2.17 |
Full-time law enforcement employees in 2010, including police officers: 238 (186 officers - 171 male; 15 female).
| Officers per 1,000 residents here: | 1.92 |
| Texas average: | 2.20 |
Full-time law enforcement employees in 2009, including police officers: 238 (183 officers - 168 male; 15 female).
| Officers per 1,000 residents here: | 1.84 |
| Texas average: | 2.23 |
Full-time law enforcement employees in 2008, including police officers: 233 (185 officers - 170 male; 15 female).
| Officers per 1,000 residents here: | 1.89 |
| Texas average: | 2.17 |
Full-time law enforcement employees in 2007, including police officers: 227 (179 officers - 163 male; 16 female).
| Officers per 1,000 residents here: | 1.87 |
| Texas average: | 2.18 |
Full-time law enforcement employees in 2006, including police officers: 227 (178 officers - 164 male; 14 female).
| Officers per 1,000 residents here: | 1.88 |
| Texas average: | 2.13 |
Full-time law enforcement employees in 2005, including police officers: 220 (170 officers - 158 male; 12 female).
| Officers per 1,000 residents here: | 1.87 |
| Texas average: | 2.18 |
Full-time law enforcement employees in 2004, including police officers: 231 (180 officers - 164 male; 16 female).
| Officers per 1,000 residents here: | 2.00 |
| Texas average: | 2.19 |
Full-time law enforcement employees in 2003, including police officers: 237 (182 officers - 166 male; 16 female).
| Officers per 1,000 residents here: | 2.06 |
| Texas average: | 2.17 |