Albion: Fire Incidents, Michigan (MI)
Where are fire incidents reported in Albion, MI
Something went wrong! Please refresh the page.
| Fire incidents reported | |
|---|---|
| Sreet name | Count |
| MICHIGAN AVE | 134 |
| ERIE ST | 90 |
| EATON ST | 66 |
| C DR | 62 |
| 24 MILE RD | 58 |
| B DR | 58 |
| I-94 | 56 |
| CALHOUN RD | 54 |
| 28 MILE RD | 50 |
| BROADWELL ST | 50 |
| J DR | 50 |
| SUPERIOR ST | 50 |
| 26 MILE RD | 46 |
| 29 MILE RD | 44 |
| ALBION ST | 38 |
| ASH ST | 38 |
| EATON RAPIDS RD | 34 |
| NORTH ST | 34 |
| H DR | 32 |
| I-94 HWY | 32 |
| CASS ST | 30 |
| ERIE RD | 30 |
| BOYD DR | 28 |
| D DR | 26 |
| GIBBS RD | 26 |
| I94 HWY | 26 |
| 27 MILE RD | 24 |
| AUSTIN AVE | 24 |
| CLARK ST | 24 |
| DALRYMPLE ST | 22 |
| Other | 29 |
2002 - 2018 National Fire Incident Reporting System (NFIRS) incidents
- Incident types reported to NFIRS in Albion, MI
- 1,36543.5%Fire
- 55717.8%Hazardous Condition
- 42913.7%Rescue & EMS
- 39012.4%Good Intent Call
- 1986.3%False Alarm
- 1655.3%Service Call
- 130.4%Special Incident
- 100.3%Severe Weather
- 80.3%Overpressure Rupture
- Fire incident types reported to NFIRS in Albion, MI
- 61945.3%Structure Fires
- 51437.7%Outside Fires
- 19714.4%Mobile Property/Vehicle Fires
- 352.6%Other
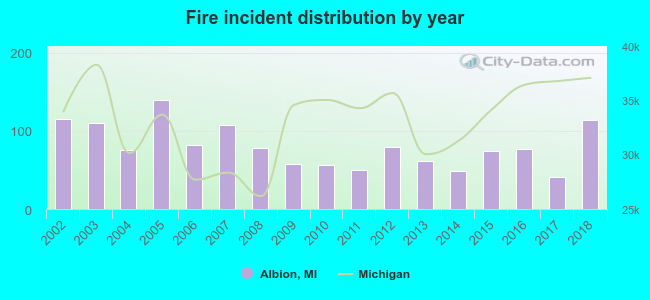 According to the data from the years 2002 - 2018 the average number of fire incidents per year is 80. The highest number of reported fire incidents - 139 took place in 2005, and the least - 41 in 2017. The data has a decreasing trend.
The average number of yearly fire incidents per 10k residents in Albion, MI compared to nearest cities:
(Note: Based on data for the last 3 years, including only cities with population 5,000 and above)
| Albion: | 93.5 |
| Marshall: | 75.8 |
| Jackson: | 120.5 |
| Eaton Rapids: | 87.5 |
| Charlotte: | 81.7 |
| Hillsdale: | 35.2 |
| Battle Creek: | 54.7 |
| Coldwater: | 70.3 |
| Springfield: | 46.1 |
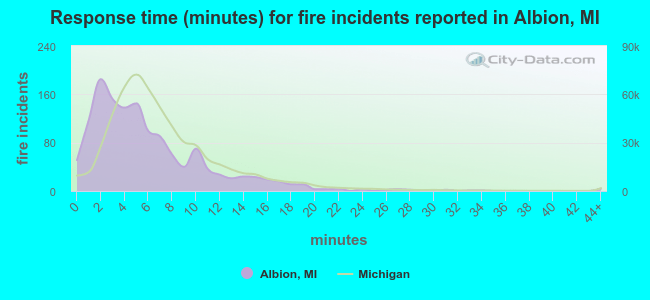 The median response time based on all reported fire incidents is 5 minutes. This is lower compared to the state median value.
The median response time in Albion, MI compared to nearest cities:
(Note: Based on data for all years, including only cities with at least 500 fire incidents)
| Albion: | 5 minutes |
| Parma: | 10 minutes |
| Marshall: | 7 minutes |
| Jackson: | 5 minutes |
| Eaton Rapids: | 10 minutes |
| Charlotte: | 6 minutes |
| Hillsdale: | 6 minutes |
| Union City: | 8 minutes |
| Battle Creek: | 5 minutes |
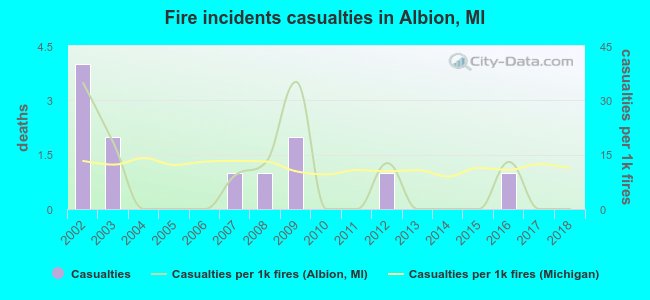 Based on the reports from the years 2002 - 2018 the average number of fire-related casualties per year is 1. The highest number of reported casualties - 4 took place in 2002, and the lowest - 0 in 2004. The data has a decreasing trend.
The average number of injuries per 1,000 fires is 8. This indicator was the highest - 35 in 2009, and the lowest 0 in 2004. The trend for casualties per 1,000 incidents is declining. Compared to the state value the number of casualties per 1,000 fire incidents is lower.
Based on the reports from the years 2002 - 2018 the average number of fire-related casualties per year is 1. The highest number of reported casualties - 4 took place in 2002, and the lowest - 0 in 2004. The data has a decreasing trend.
The average number of injuries per 1,000 fires is 8. This indicator was the highest - 35 in 2009, and the lowest 0 in 2004. The trend for casualties per 1,000 incidents is declining. Compared to the state value the number of casualties per 1,000 fire incidents is lower.Casualties per 1,000 incidents in Albion, MI compared to nearest cities:
(Note: Based on data for all years, including only cities with at least 500 fire incidents)
| Albion: | 8.8 |
| Parma: | 3.8 |
| Marshall: | 8.6 |
| Jackson: | 16.0 |
| Eaton Rapids: | 11.1 |
| Charlotte: | 20.3 |
| Hillsdale: | 4.8 |
| Union City: | 1.8 |
| Battle Creek: | 13.2 |
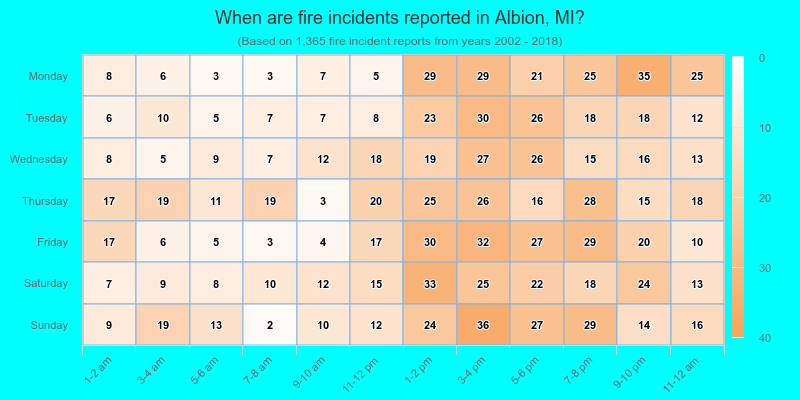
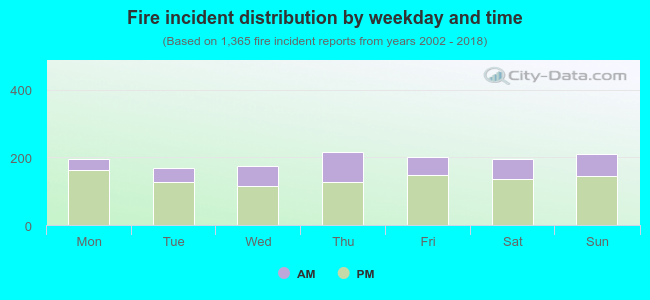 29.4% incidents where reported in the morning and 70.6% in the evening. The most fires (15.9%) took place on Thursday, and the least (12.5%) on Tuesday.
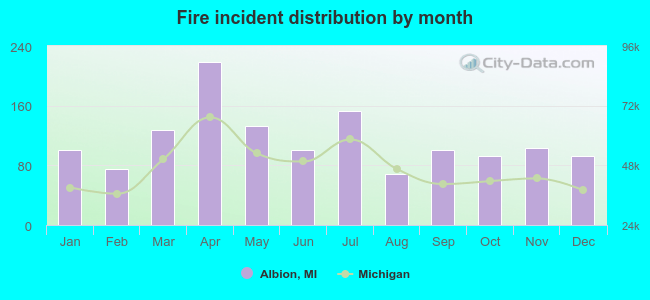 Based on the 1,365 reports from years 2002 - 2018 most fires (16.0%) took place during April, and the least (5.1%) in August.
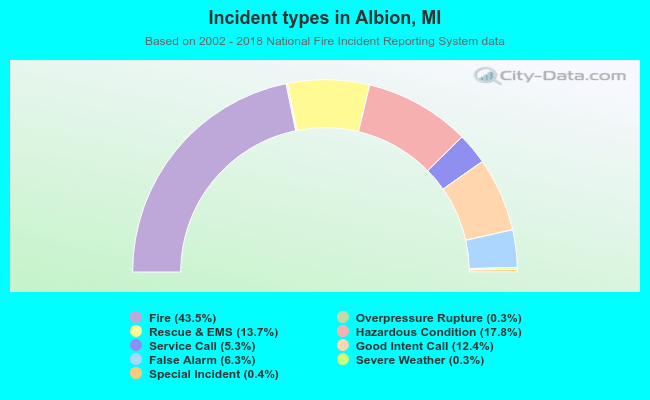 Out of all 3,135 cases reported during the years 2002 - 2018, the most belonged to the categories: Fire (43.5%), Hazardous Condition (17.8%), and Rescue & EMS (13.7%).
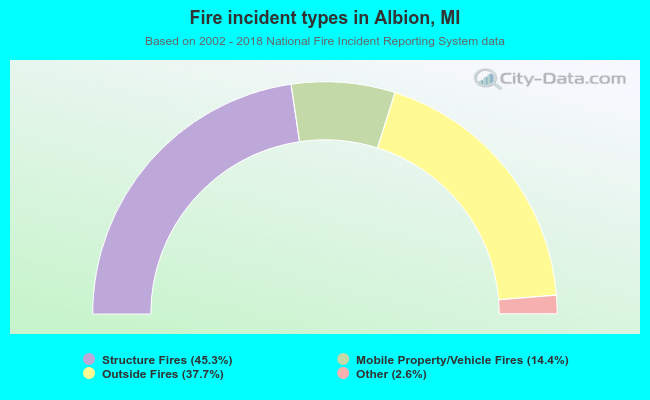 When looking into fire subcategories, the most incidents belonged to: Structure Fires (45.3%), and Outside Fires (37.7%).