Alexandria: Fire Incidents, Virginia (VA)
Where are fire incidents reported in Alexandria, VA
Something went wrong! Please refresh the page.
| Fire incidents reported | |
|---|---|
| Sreet name | Count |
| SEMINARY RD | 1,132 |
| DUKE ST | 812 |
| RICHMOND HWY | 516 |
| KING ST | 490 |
| VAN DORN ST | 396 |
| REYNOLDS ST | 338 |
| EISENHOWER AVE | 302 |
| BEAUREGARD ST | 298 |
| EDSALL RD | 258 |
| BRADDOCK RD | 222 |
| KENMORE AVE | 212 |
| MT VERNON AVE | 202 |
| WHITING ST | 200 |
| ARMISTEAD ST | 196 |
| QUANTRELL AVE | 186 |
| FOUR MILE RD | 170 |
| WASHINGTON ST | 166 |
| JEFFERSON DAVIS HWY | 134 |
| SEMINARY | 130 |
| PARK CENTER DR | 126 |
| CAMERON RUN TER | 120 |
| PICKETT ST | 114 |
| FILLMORE AVE | 112 |
| GLEBE RD | 110 |
| HOLMES RUN PKY | 108 |
| LITTLE RIVER TPKE | 102 |
| TANEY AVE | 102 |
| COLUMBUS ST | 96 |
| RUSSELL RD | 96 |
| MANITOBA DR | 92 |
| Other | 3,670 |
2002 - 2018 National Fire Incident Reporting System (NFIRS) incidents
- Incident types reported to NFIRS in Alexandria, VA
- 113,74660.2%Rescue & EMS
- 20,82811.0%Good Intent Call
- 15,5658.2%False Alarm
- 14,2697.6%Hazardous Condition
- 12,5076.6%Service Call
- 11,2085.9%Fire
- 3400.2%Overpressure Rupture
- 2540.1%Special Incident
- Fire incident types reported to NFIRS in Alexandria, VA
- 6,18355.2%Structure Fires
- 3,12727.9%Outside Fires
- 1,25111.2%Mobile Property/Vehicle Fires
- 6475.8%Other
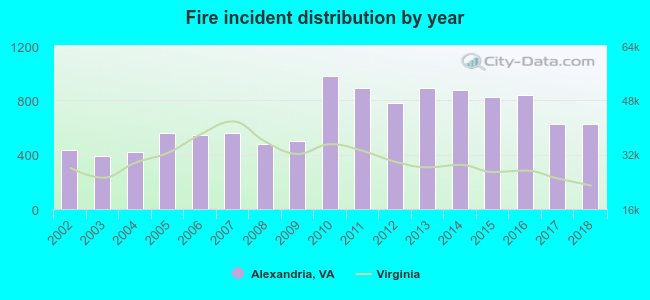 According to the data from the years 2002 - 2018 the average number of fires per year is 659. The highest number of reported fire incidents - 978 took place in 2010, and the least - 392 in 2003. The data has an increasing trend.
The average number of yearly fire incidents per 10k residents in Alexandria, VA compared to nearest cities:
(Note: Based on data for the last 3 years, including only cities with population 5,000 and above)
| Alexandria: | 46.2 |
| Rose Hill: | 4.1 |
| Arlington: | 17.1 |
| Seven Corners: | 15.1 |
| Springfield: | 41.9 |
| Jefferson: | 1.1 |
| Falls Church: | 173.3 |
| North Springfield: | 22.0 |
| Annandale: | 25.5 |
 The median response time based on all reported fire incidents is 5 minutes. This is lower than the Virginia median value.
The median response time in Alexandria, VA compared to nearest cities:
(Note: Based on data for all years, including only cities with at least 500 fire incidents)
| Alexandria: | 5 minutes |
| Oxon Hill: | 7 minutes |
| Arlington: | 5 minutes |
| Fort Washington: | 8 minutes |
| Springfield: | 6 minutes |
| Falls Church: | 5 minutes |
| Washington: | 4 minutes |
| Annandale: | 5 minutes |
| Suitland: | 6 minutes |
 Based on the data from the years 2002 - 2018 the average number of fire-related yearly deaths is 0. The highest number of reported deaths - 2 took place in 2013, and the lowest - 0 in 2003. The data has a decreasing trend.
The average number of fatalities per 1,000 fires is 0. This indicator was the highest - 2 in 2002, and the lowest 0 in 2003. The trend for deaths per 1,000 fires is dropping. Compared to the state value the number of deaths per 1,000 incidents is much lower.
Based on the data from the years 2002 - 2018 the average number of fire-related yearly deaths is 0. The highest number of reported deaths - 2 took place in 2013, and the lowest - 0 in 2003. The data has a decreasing trend.
The average number of fatalities per 1,000 fires is 0. This indicator was the highest - 2 in 2002, and the lowest 0 in 2003. The trend for deaths per 1,000 fires is dropping. Compared to the state value the number of deaths per 1,000 incidents is much lower.Deaths per 1,000 incidents in Alexandria, VA compared to nearest cities:
(Note: Based on data for all years, including only cities with at least 2,500 fire incidents)
| Alexandria: | 0.4 |
| Arlington: | 0.0 |
| Falls Church: | 1.1 |
| Washington: | 1.5 |
 According to the data from the years 2002 - 2018 the average number of fire-related yearly casualties is 4. The highest number of casualties - 15 took place in 2003, and the lowest - 0 in 2009. The data has a dropping trend.
The average number of casualties per 1,000 fire incidents is 9. This indicator was the highest - 38 in 2003, and the lowest 0 in 2009. The trend for casualties per 1,000 fires is decreasing. Compared to the state value the number of injuries per 1,000 incidents is lower.
According to the data from the years 2002 - 2018 the average number of fire-related yearly casualties is 4. The highest number of casualties - 15 took place in 2003, and the lowest - 0 in 2009. The data has a dropping trend.
The average number of casualties per 1,000 fire incidents is 9. This indicator was the highest - 38 in 2003, and the lowest 0 in 2009. The trend for casualties per 1,000 fires is decreasing. Compared to the state value the number of injuries per 1,000 incidents is lower.Casualties per 1,000 incidents in Alexandria, VA compared to nearest cities:
(Note: Based on data for all years, including only cities with at least 500 fire incidents)
| Alexandria: | 6.6 |
| Oxon Hill: | 9.1 |
| Arlington: | 2.3 |
| Fort Washington: | 8.6 |
| Springfield: | 2.0 |
| Falls Church: | 0.4 |
| Washington: | 1.1 |
| Annandale: | 6.0 |
| Suitland: | 10.0 |
 30.3% incidents where reported in the morning and 69.7% in the evening. The most fires (16.3%) took place on Sunday, and the least (13.0%) on Thursday.
 Based on the 11,208 reports from years 2002 - 2018 most fires (10.8%) took place during April, and the least (6.9%) in September.
 Out of all 188,822 cases reported during the years 2002 - 2018, the most belonged to the categories: Rescue & EMS (60.2%), Good Intent Call (11.0%), and False Alarm (8.2%).
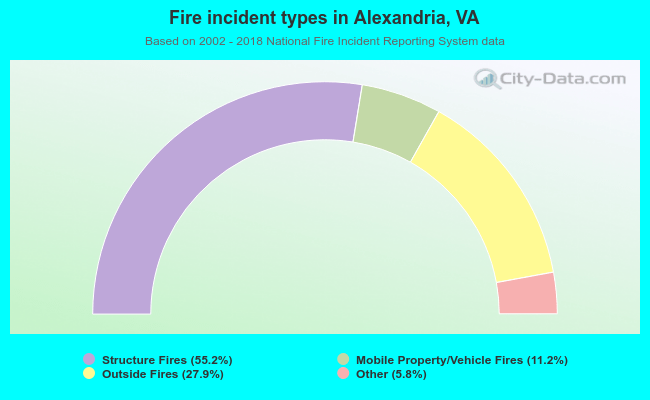 When looking into fire subcategories, the most incidents belonged to: Structure Fires (55.2%), and Outside Fires (27.9%).