Big Rapids: Fire Incidents, Michigan (MI)
Where are fire incidents reported in Big Rapids, MI
Something went wrong! Please refresh the page.
| Fire incidents reported | |
|---|---|
| Sreet name | Count |
| 14 MILE RD | 64 |
| STATE ST | 50 |
| STATE | 48 |
| NORTHLAND DR | 42 |
| MICHIGAN AVE | 36 |
| 16 MILE RD | 34 |
| MAPLE ST | 30 |
| MICHIGAN | 26 |
| PERRY AVE | 24 |
| WARREN | 24 |
| WARREN AVE | 24 |
| FULLER | 22 |
| 230TH AVE | 20 |
| FULLER AVE | 18 |
| 175TH AVE | 16 |
| 190TH AVE | 16 |
| 220TH AVE | 16 |
| X-WAY 131 FWY | 16 |
| 11 MILE RD | 14 |
| 150TH AVE | 14 |
| 21 MILE RD | 14 |
| FOURTH AVE | 14 |
| PERRY ST | 14 |
| SECOND AVE | 14 |
| WOODWARD AVE | 14 |
| 12 MILE RD | 12 |
| 13 MILE RD | 12 |
| 160TH AVE | 12 |
| 17 MILE RD | 12 |
| 190TH | 12 |
| Other | 373 |
2002 - 2018 National Fire Incident Reporting System (NFIRS) incidents
- Incident types reported to NFIRS in Big Rapids, MI
- 4,35461.3%Rescue & EMS
- 1,05714.9%Fire
- 86312.2%Hazardous Condition
- 3264.6%False Alarm
- 2563.6%Good Intent Call
- 1912.7%Service Call
- 230.3%Special Incident
- 160.2%Severe Weather
- 140.2%Overpressure Rupture
- Fire incident types reported to NFIRS in Big Rapids, MI
- 45242.8%Structure Fires
- 39837.7%Outside Fires
- 16515.6%Mobile Property/Vehicle Fires
- 424.0%Other
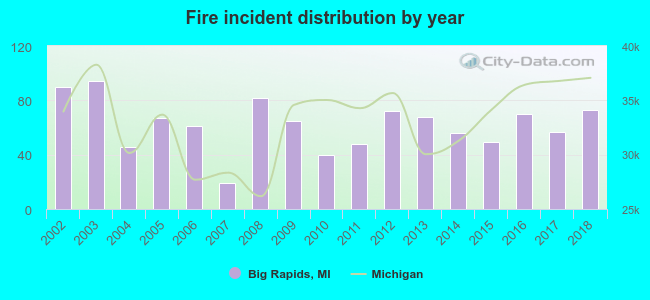 Based on the data from the years 2002 - 2018 the average number of fires per year is 62. The highest number of fire incidents - 94 took place in 2003, and the least - 19 in 2007. The data has a declining trend.
The average number of yearly fire incidents per 10k residents in Big Rapids, MI compared to nearest cities:
(Note: Based on data for the last 3 years, including only cities with population 5,000 and above)
| Big Rapids: | 63.8 |
| Mount Pleasant: | 0.9 |
| Greenville: | 71.6 |
| Cadillac: | 110.0 |
| Rockford: | 153.5 |
| Belding: | 102.6 |
| Comstock Park: | 62.8 |
| Alma: | 58.9 |
| Walker: | 31.9 |
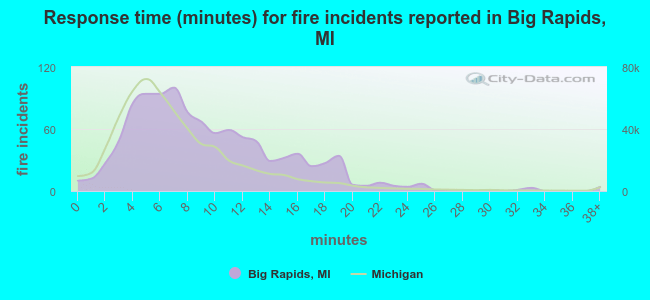 The median response time based on all reported fire incidents is 8 minutes. This is higher than the state median value.
The median response time in Big Rapids, MI compared to nearest cities:
(Note: Based on data for all years, including only cities with at least 500 fire incidents)
| Big Rapids: | 8 minutes |
| Reed City: | 12 minutes |
| White Cloud: | 11 minutes |
| Baldwin: | 9 minutes |
| Newaygo: | 9 minutes |
| Fremont: | 9 minutes |
| Grant: | 10 minutes |
| Cedar Springs: | 7 minutes |
| Clare: | 12 minutes |
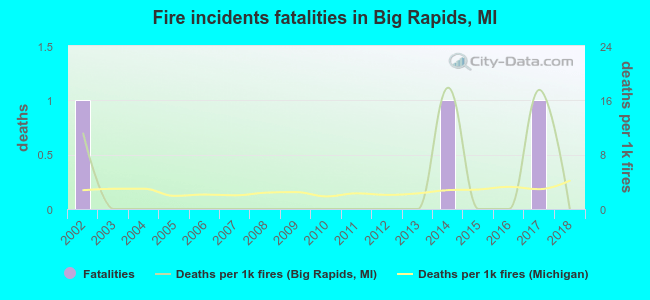 According to the data from the years 2002 - 2018 the average number of fire-related yearly deaths is 0. The highest number of deaths - 1 took place in 2002, and the lowest - 0 in 2003. The data has a declining trend.
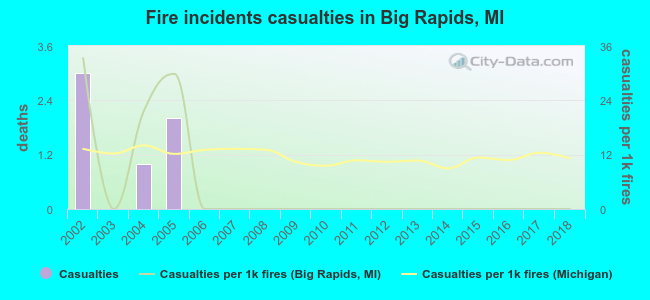 Based on the reports from the years 2002 - 2018 the average number of fire-related casualties per year is 0. The highest number of casualties - 3 took place in 2002, and the lowest - 0 in 2003. The data has a dropping trend.
The average number of casualties per 1,000 fire incidents is 5. This indicator was the highest - 33 in 2002, and the lowest 0 in 2003. The trend for injuries per 1,000 incidents is dropping. Compared to the Michigan value the number of injuries per 1,000 fire incidents is much lower.
Based on the reports from the years 2002 - 2018 the average number of fire-related casualties per year is 0. The highest number of casualties - 3 took place in 2002, and the lowest - 0 in 2003. The data has a dropping trend.
The average number of casualties per 1,000 fire incidents is 5. This indicator was the highest - 33 in 2002, and the lowest 0 in 2003. The trend for injuries per 1,000 incidents is dropping. Compared to the Michigan value the number of injuries per 1,000 fire incidents is much lower.Casualties per 1,000 incidents in Big Rapids, MI compared to nearest cities:
(Note: Based on data for all years, including only cities with at least 500 fire incidents)
| Big Rapids: | 5.7 |
| Reed City: | 1.8 |
| White Cloud: | 1.4 |
| Baldwin: | 1.3 |
| Newaygo: | 3.4 |
| Fremont: | 1.5 |
| Grant: | 0.0 |
| Cedar Springs: | 11.7 |
| Clare: | 1.4 |
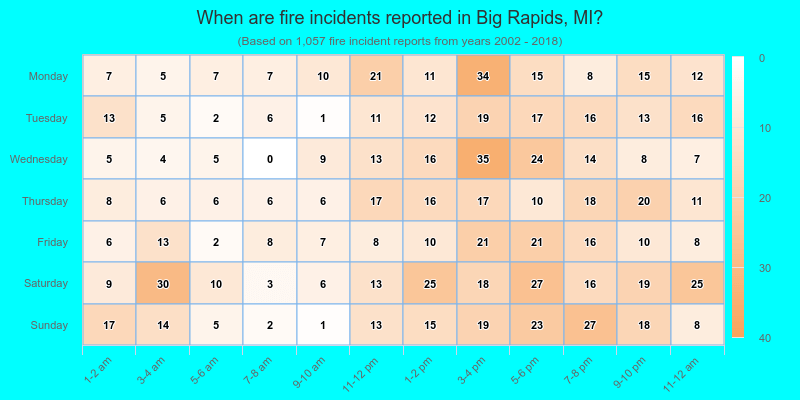
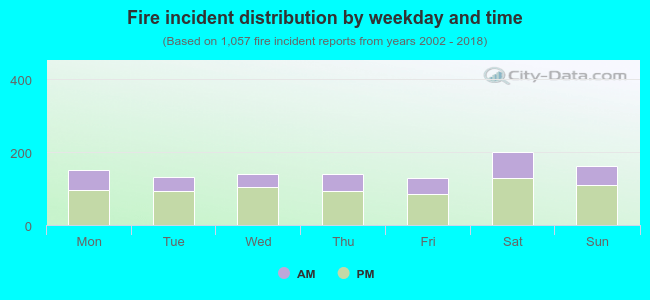 32.8% incidents where reported in the morning and 67.2% in the evening. The most fires (19.0%) took place on Saturday, and the least (12.3%) on Friday.
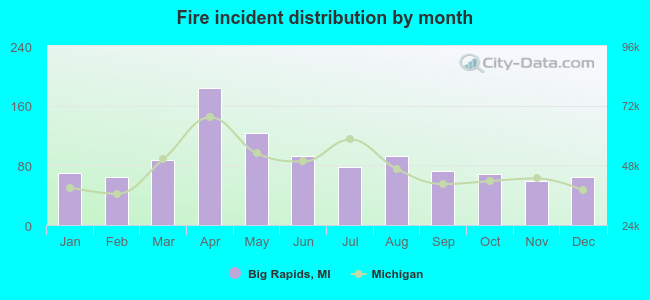 Based on the 1,057 fire incidents from years 2002 - 2018 most fires (17.4%) took place during April, and the least (5.6%) in November.
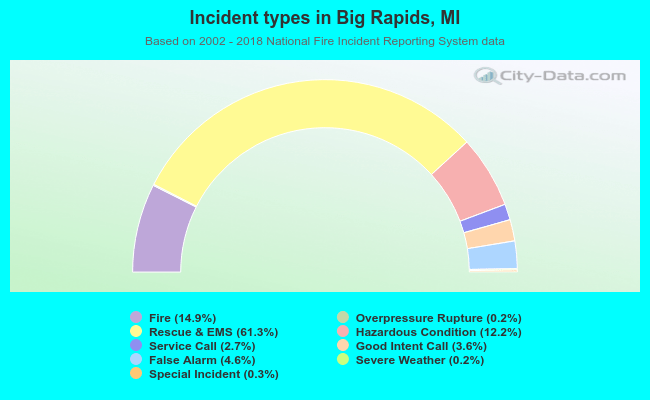 Out of all 7,100 cases reported during the years 2002 - 2018, the most belonged to the categories: Rescue & EMS (61.3%), Fire (14.9%), and Hazardous Condition (12.2%).
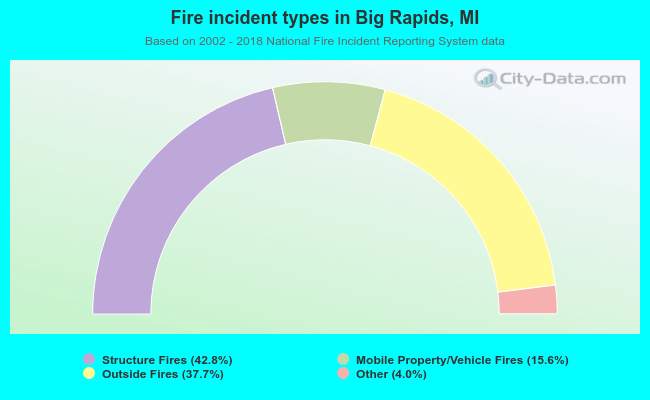 When looking into fire subcategories, the most reports belonged to: Structure Fires (42.8%), and Outside Fires (37.7%).