Brownfield: Fire Incidents, Texas (TX)
Where are fire incidents reported in Brownfield, TX
Something went wrong! Please refresh the page.
|
| |||||||||||||||||||||||||||||||||||||||||||||||||||||||||||||||||||||||||||||||||||||||||||||||||||||||||||||
| Other | 231 | |||||||||||||||||||||||||||||||||||||||||||||||||||||||||||||||||||||||||||||||||||||||||||||||||||||||||||||
2002 - 2018 National Fire Incident Reporting System (NFIRS) incidents
- Incident types reported to NFIRS in Brownfield, TX
- 1,55164.8%Fire
- 36715.3%Rescue & EMS
- 1305.4%False Alarm
- 1285.3%Hazardous Condition
- 1235.1%Good Intent Call
- 702.9%Service Call
- 210.9%Special Incident
- 30.1%Overpressure Rupture
- Fire incident types reported to NFIRS in Brownfield, TX
- 1,02265.9%Outside Fires
- 25616.5%Structure Fires
- 20113.0%Mobile Property/Vehicle Fires
- 724.6%Other
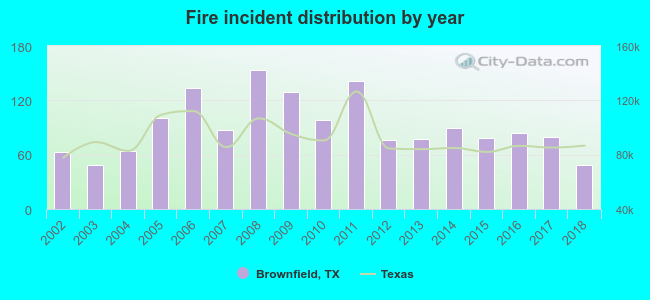 According to the data from the years 2002 - 2018 the average number of fires per year is 91. The highest number of fire incidents - 154 took place in 2008, and the least - 49 in 2003. The data has a declining trend.
The average number of yearly fire incidents per 10k residents in Brownfield, TX compared to nearest cities:
(Note: Based on data for the last 3 years, including only cities with population 5,000 and above)
| Brownfield: | 72.7 |
| Levelland: | 85.5 |
| Lubbock: | 35.6 |
| Lamesa: | 108.8 |
| Seminole: | 2.8 |
| Slaton: | 57.1 |
| Littlefield: | 125.1 |
| Andrews: | 141.4 |
| Plainview: | 59.5 |
 The median response time based on all reported fire incidents is 6 minutes. This is close to the state median value.
The median response time in Brownfield, TX compared to nearest cities:
(Note: Based on data for all years, including only cities with at least 500 fire incidents)
| Brownfield: | 6 minutes |
| Levelland: | 7 minutes |
| Lubbock: | 5 minutes |
| Denver City: | 6 minutes |
| Lamesa: | 6 minutes |
| Shallowater: | 10 minutes |
| Slaton: | 5 minutes |
| Littlefield: | 9 minutes |
| Hobbs: | 5 minutes |
 25.3% incidents where reported in the morning and 74.7% in the evening. The most fires (15.3%) took place on Sunday, and the least (13.2%) on Tuesday.
 Based on the 1,551 reports from years 2002 - 2018 most fires (10.3%) took place during June, and the least (5.5%) in September.
 Out of all 2,393 cases reported during the years 2002 - 2018, the most belonged to the categories: Fire (64.8%), Rescue & EMS (15.3%), and False Alarm (5.4%).
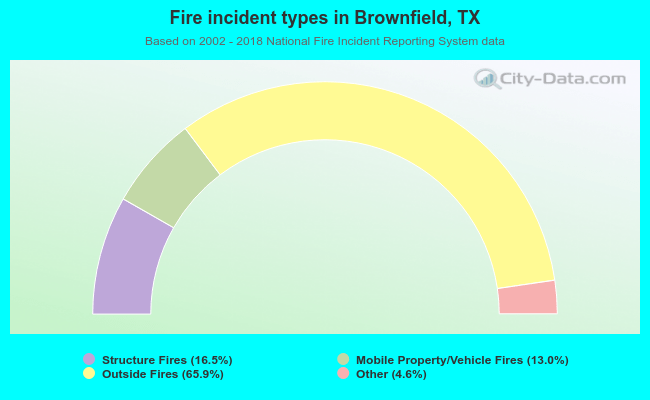 When looking into fire subcategories, the most reports belonged to: Outside Fires (65.9%), and Structure Fires (16.5%).