Burkburnett: Fire Incidents, Texas (TX)
Where are fire incidents reported in Burkburnett, TX
Something went wrong! Please refresh the page.
| Fire incidents reported | |
|---|---|
| Sreet name | Count |
| I44 | 92 |
| 3RD ST | 84 |
| SHEPPARD RD | 60 |
| FM 369 | 56 |
| DANIELS RD | 54 |
| SYCAMORE | 44 |
| SHALLOWFIELD RD | 40 |
| D AVE | 38 |
| GRESHAM RD | 38 |
| MORGAN RD | 38 |
| I44 HWY | 36 |
| ASHTON RD | 34 |
| F AVE | 34 |
| 1ST ST | 32 |
| AMERON RD | 32 |
| FM 368 | 32 |
| SCHMOKER RD | 32 |
| COLLEGE | 30 |
| HOLMAN RD | 30 |
| 6TH ST | 28 |
| RED RIVER EXPY | 28 |
| 4TH ST | 26 |
| VAUGHN RD | 26 |
| WALKER RD | 26 |
| B AVE | 24 |
| PRESTON | 24 |
| BACON SWITCH RD | 22 |
| BERRY ST | 22 |
| RAMMING RD | 22 |
| FM 1177 | 20 |
| Other | 653 |
2002 - 2018 National Fire Incident Reporting System (NFIRS) incidents
- Incident types reported to NFIRS in Burkburnett, TX
- 1,75755.2%Fire
- 54317.0%Hazardous Condition
- 36711.5%Rescue & EMS
- 2347.3%Good Intent Call
- 1655.2%False Alarm
- 953.0%Service Call
- 230.7%Severe Weather
- Fire incident types reported to NFIRS in Burkburnett, TX
- 1,15365.6%Outside Fires
- 38822.1%Structure Fires
- 18010.2%Mobile Property/Vehicle Fires
- 362.0%Other
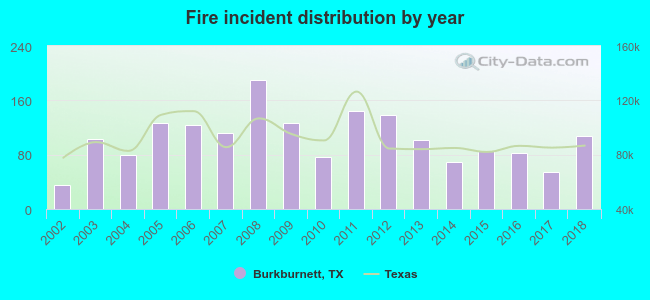 According to the data from the years 2002 - 2018 the average number of fires per year is 103. The highest number of reported fires - 190 took place in 2008, and the least - 36 in 2002. The data has a rising trend.
The average number of yearly fire incidents per 10k residents in Burkburnett, TX compared to nearest cities:
(Note: Based on data for the last 3 years, including only cities with population 5,000 and above)
| Burkburnett: | 73.3 |
| Iowa Park: | 141.9 |
| Wichita Falls: | 49.7 |
| Vernon: | 115.2 |
| Bowie: | 40.1 |
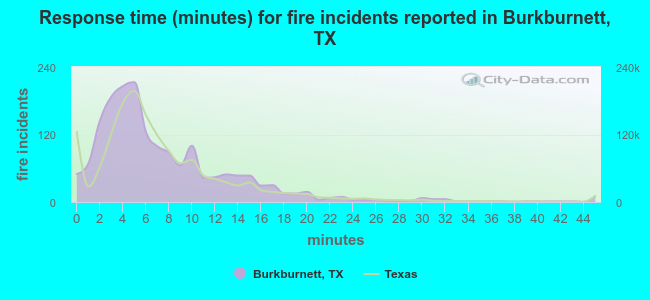 The median response time based on all reported fire incidents is 6 minutes. This is close to the Texas median value.
The median response time in Burkburnett, TX compared to nearest cities:
(Note: Based on data for all years, including only cities with at least 500 fire incidents)
| Burkburnett: | 6 minutes |
| Iowa Park: | 7 minutes |
| Wichita Falls: | 4 minutes |
| Walters: | 9 minutes |
| Lawton: | 4 minutes |
| Cache: | 10 minutes |
| Vernon: | 7 minutes |
| Duncan: | 5 minutes |
| Marlow: | 7 minutes |
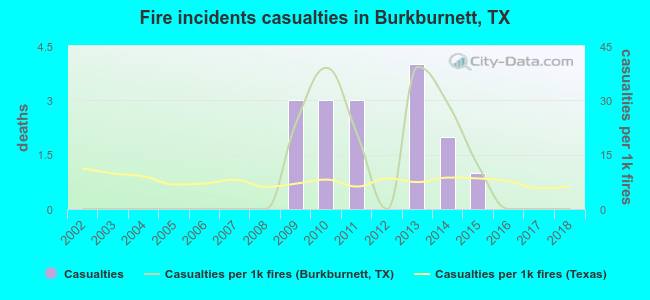 Based on the reports from the years 2002 - 2018 the average number of fire-related yearly casualties is 1. The highest number of reported injuries - 4 took place in 2013, and the lowest - 0 in 2002. The data has a constant trend.
The average number of casualties per 1,000 fires is 10. This indicator was the highest - 39 in 2013, and the lowest 0 in 2002. The trend for casualties per 1,000 incidents is dropping. Compared to the state value the number of injuries per 1,000 fires is about the same.
Based on the reports from the years 2002 - 2018 the average number of fire-related yearly casualties is 1. The highest number of reported injuries - 4 took place in 2013, and the lowest - 0 in 2002. The data has a constant trend.
The average number of casualties per 1,000 fires is 10. This indicator was the highest - 39 in 2013, and the lowest 0 in 2002. The trend for casualties per 1,000 incidents is dropping. Compared to the state value the number of injuries per 1,000 fires is about the same.
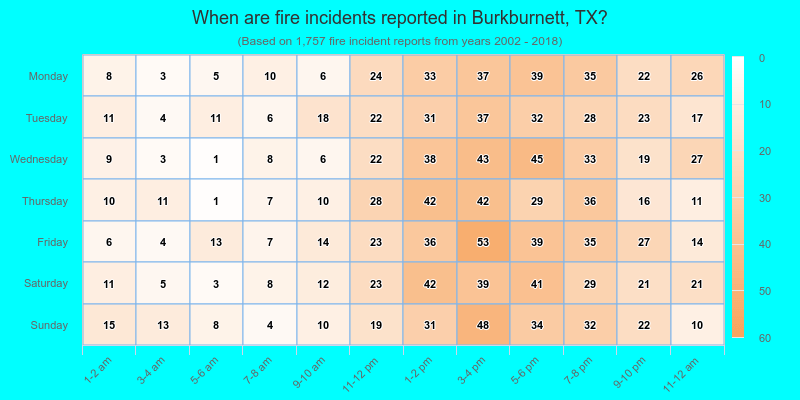
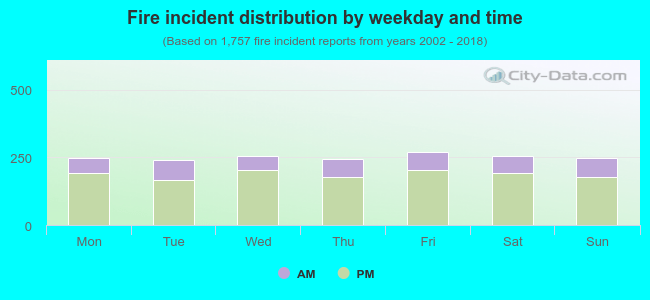 25.2% incidents where reported in the morning and 74.8% in the evening. The most fires (15.4%) took place on Friday, and the least (13.7%) on Tuesday.
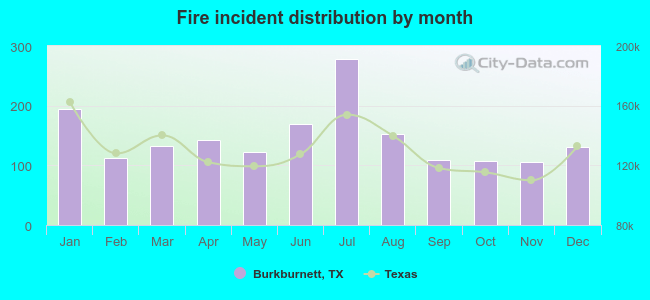 According to the 1,757 incident reports from years 2002 - 2018 most fires (15.8%) took place during July, and the least (6.0%) in November.
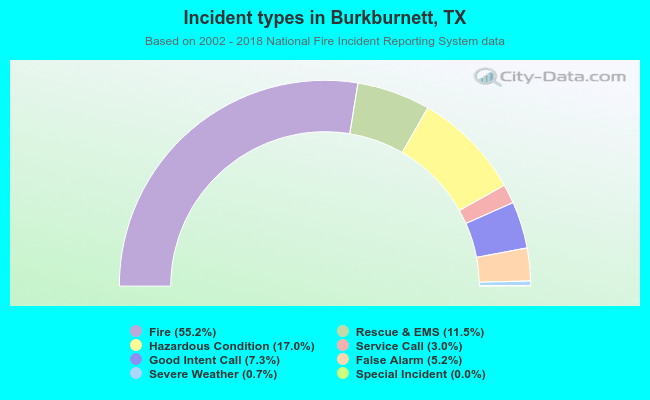 Out of all 3,185 cases reported during the years 2002 - 2018, the most belonged to the categories: Fire (55.2%), Rescue & EMS (17.0%), and Overpressure Rupture (11.5%).
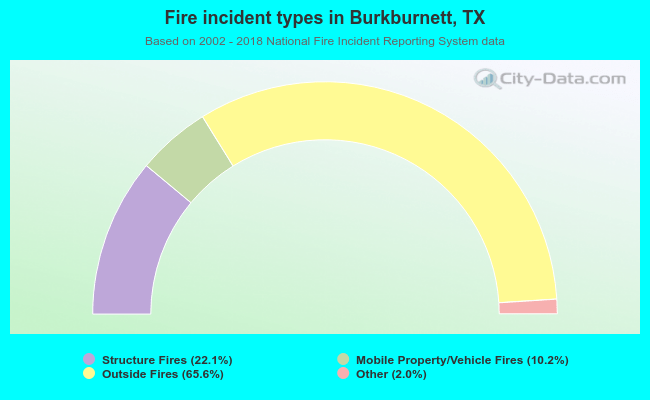 When looking into fire subcategories, the most reports belonged to: Outside Fires (65.6%), and Structure Fires (22.1%).