Burton: Fire Incidents, Michigan (MI)
Where are fire incidents reported in Burton, MI
Something went wrong! Please refresh the page.
| Fire incidents reported | |
|---|---|
| Sreet name | Count |
| CENTER RD | 204 |
| BRISTOL RD | 138 |
| FENTON RD | 116 |
| BELSAY RD | 100 |
| COURT ST | 100 |
| DORT HWY | 100 |
| SAGINAW ST | 80 |
| DAVISON RD | 78 |
| BOULDER DR | 64 |
| GENESEE RD | 62 |
| SCOTTWOOD ST | 54 |
| KINGS LN | 48 |
| ATHERTON RD | 46 |
| LAPEER RD | 42 |
| HEMPHILL RD | 40 |
| CONNELL ST | 34 |
| KENNETH ST | 34 |
| TERM ST | 30 |
| NORTON ST | 28 |
| KLEINPELL ST | 22 |
| JIMBO DR | 20 |
| PARKWOOD ST | 20 |
| VASSAR RD | 20 |
| BERGIN ST | 18 |
| KINGSLANE ST | 18 |
| LASALLE ST | 18 |
| WAREHOUSE DR | 18 |
| DECAMP ST | 16 |
| JUDD RD | 16 |
| BLACKBERRY CRK | 14 |
2002 - 2018 National Fire Incident Reporting System (NFIRS) incidents
- Incident types reported to NFIRS in Burton, MI
- 1,48428.2%Fire
- 1,34325.6%Hazardous Condition
- 1,00419.1%Good Intent Call
- 82415.7%Service Call
- 5149.8%False Alarm
- 641.2%Rescue & EMS
- 170.3%Overpressure Rupture
- 60.1%Severe Weather
- Fire incident types reported to NFIRS in Burton, MI
- 80954.5%Structure Fires
- 32021.6%Mobile Property/Vehicle Fires
- 30820.8%Outside Fires
- 473.2%Other
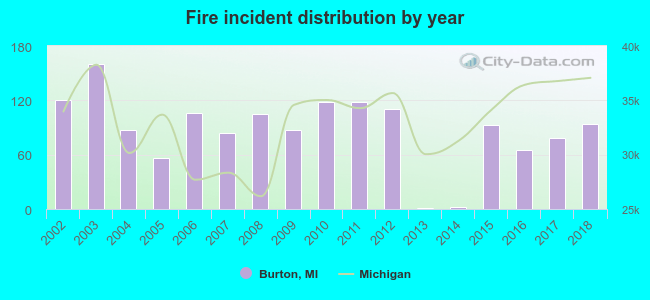 According to the data from the years 2002 - 2018 the average number of fires per year is 87. The highest number of reported fires - 160 took place in 2003, and the least - 1 in 2013. The data has a decreasing trend.
The average number of yearly fire incidents per 10k residents in Burton, MI compared to nearest cities:
(Note: Based on data for the last 3 years, including only cities with population 5,000 and above)
| Burton: | 27.3 |
| Flint: | 89.8 |
| Grand Blanc: | 145.6 |
| Davison: | 116.7 |
| Swartz Creek: | 131.2 |
| Flushing: | 100.8 |
| Holly: | 105.5 |
| Fenton: | 91.6 |
| Lapeer: | 123.3 |
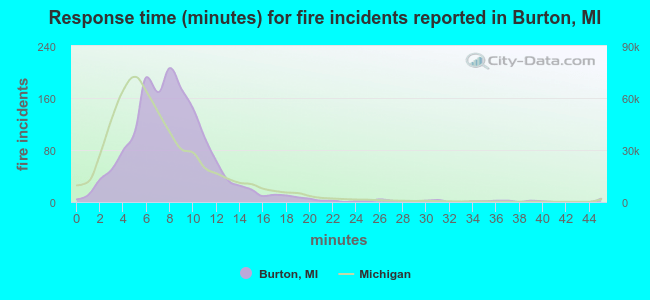 The median response time based on all reported fire incidents is 8 minutes. This is higher than the Michigan median value.
The median response time in Burton, MI compared to nearest cities:
(Note: Based on data for all years, including only cities with at least 500 fire incidents)
| Burton: | 8 minutes |
| Flint: | 7 minutes |
| Grand Blanc: | 8 minutes |
| Davison: | 8 minutes |
| Swartz Creek: | 9 minutes |
| Flushing: | 10 minutes |
| Holly: | 8 minutes |
| Ortonville: | 7 minutes |
| Fenton: | 8 minutes |
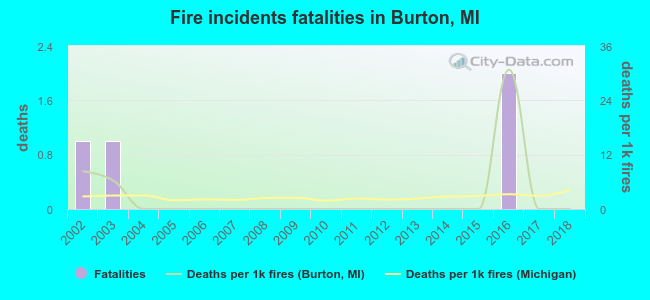 Based on the data from the years 2002 - 2018 the average number of fire-related yearly deaths is 0. The highest number of deaths - 2 took place in 2016, and the lowest - 0 in 2004. The data has a declining trend.
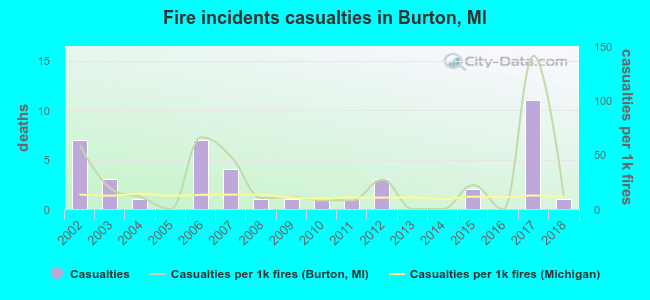 According to the data from the years 2002 - 2018 the average number of fire-related yearly casualties is 3. The highest number of reported injuries - 11 took place in 2017, and the lowest - 0 in 2005. The data has a decreasing trend.
The average number of injuries per 1,000 fire incidents is 26. This indicator was the highest - 141 in 2017, and the lowest 0 in 2005. The trend for injuries per 1,000 fires is dropping. Compared to the Michigan value the number of injuries per 1,000 incidents is much higher.
According to the data from the years 2002 - 2018 the average number of fire-related yearly casualties is 3. The highest number of reported injuries - 11 took place in 2017, and the lowest - 0 in 2005. The data has a decreasing trend.
The average number of injuries per 1,000 fire incidents is 26. This indicator was the highest - 141 in 2017, and the lowest 0 in 2005. The trend for injuries per 1,000 fires is dropping. Compared to the Michigan value the number of injuries per 1,000 incidents is much higher.Casualties per 1,000 incidents in Burton, MI compared to nearest cities:
(Note: Based on data for all years, including only cities with at least 500 fire incidents)
| Burton: | 29.0 |
| Flint: | 13.8 |
| Grand Blanc: | 9.4 |
| Davison: | 19.4 |
| Swartz Creek: | 4.3 |
| Flushing: | 9.8 |
| Holly: | 7.2 |
| Ortonville: | 14.2 |
| Fenton: | 2.8 |
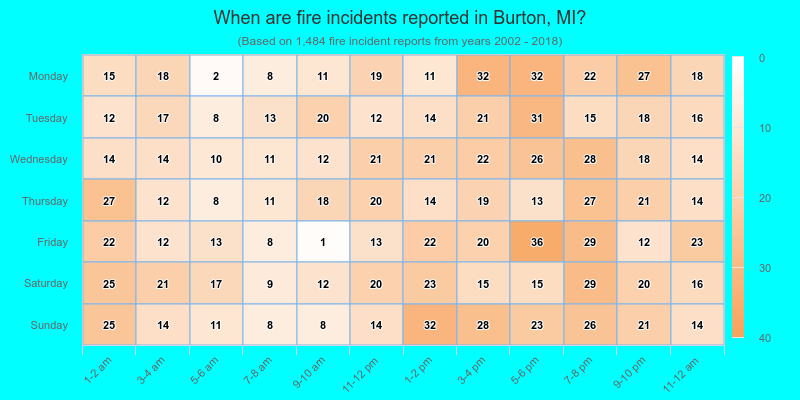
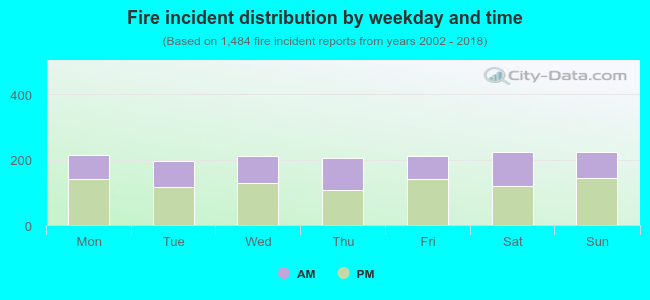 39.5% incidents where reported in the morning and 60.5% in the evening. The most fires (15.1%) took place on Sunday, and the least (13.3%) on Tuesday.
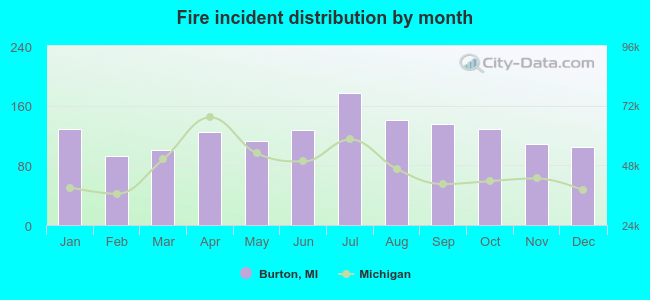 According to the 1,484 reports from years 2002 - 2018 most fires (11.9%) took place during July, and the least (6.3%) in February.
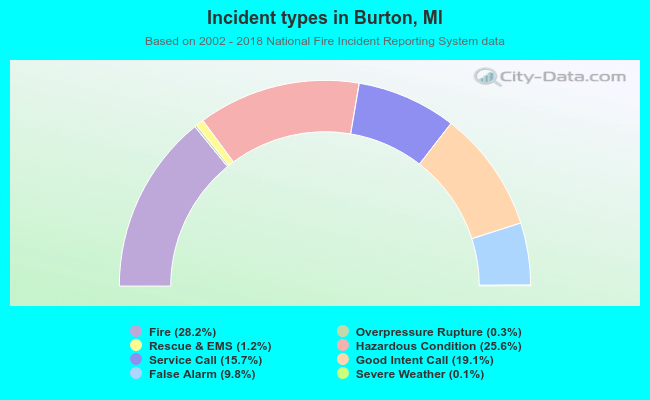 Out of all 5,256 cases reported during the years 2002 - 2018, the most belonged to the categories: Fire (28.2%), Hazardous Condition (25.6%), and Good Intent Call (19.1%).
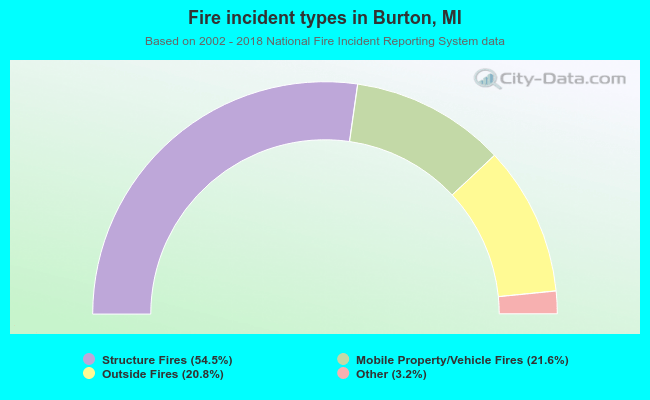 When looking into fire subcategories, the most reports belonged to: Structure Fires (54.5%), and Mobile Property/Vehicle Fires (21.6%).