Byram: Fire Incidents, Mississippi (MS)
Where are fire incidents reported in Byram, MS
Something went wrong! Please refresh the page.
| Fire incidents reported | |
|---|---|
| Sreet name | Count |
| SIWELL RD | 176 |
| TERRY RD | 112 |
| BYRAM DR | 110 |
| I-55 | 70 |
| GARY RD | 44 |
| I55 | 42 |
| FRONTAGE RD | 40 |
| HENDERSON RD | 30 |
| EAGLES NEST DR | 28 |
| OLD BYRAM RD | 28 |
| PRISOCK RD | 28 |
| LAKE DOCKERY DR | 26 |
| KAYBROOK DR | 22 |
| SPRINGRIDGE RD | 22 |
| LAKE DOCKERY RD | 20 |
| RIDGE RD | 20 |
| SPRING LAKE BLVD | 20 |
| DAVIS RD | 18 |
| FOREST HILL RD | 18 |
| RIDGELEA RD | 18 |
| ROD ST | 16 |
| HOLIDAY RAMBLER LN | 14 |
| I55 SOUTH | 14 |
| LAKESHORE DR | 14 |
| BULLRUN DR | 12 |
| HORSESHOE CIR | 12 |
| MCCARTY RD | 12 |
| REEL ST | 12 |
| WYNNDALE RD | 12 |
| FOREST WOODS DR | 10 |
2002 - 2018 National Fire Incident Reporting System (NFIRS) incidents
- Incident types reported to NFIRS in Byram, MS
- 2,78356.5%Rescue & EMS
- 97819.9%Fire
- 3717.5%False Alarm
- 2785.6%Hazardous Condition
- 2765.6%Good Intent Call
- 2124.3%Service Call
- 140.3%Overpressure Rupture
- 100.2%Severe Weather
- Fire incident types reported to NFIRS in Byram, MS
- 39240.1%Structure Fires
- 38239.1%Outside Fires
- 17317.7%Mobile Property/Vehicle Fires
- 313.2%Other
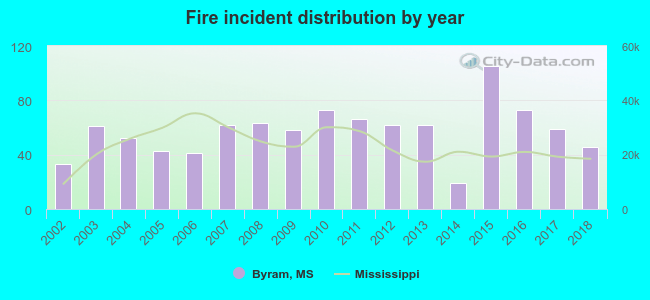 Based on the data from the years 2002 - 2018 the average number of fire incidents per year is 58. The highest number of reported fire incidents - 105 took place in 2015, and the least - 19 in 2014. The data has a growing trend.
The average number of yearly fire incidents per 10k residents in Byram, MS compared to nearest cities:
(Note: Based on data for the last 3 years, including only cities with population 5,000 and above)
| Byram: | 51.3 |
| Richland: | 54.7 |
| Jackson: | 25.9 |
| Clinton: | 27.8 |
| Pearl: | 32.7 |
| Flowood: | 56.9 |
| Brandon: | 99.6 |
| Ridgeland: | 34.4 |
| Madison: | 40.1 |
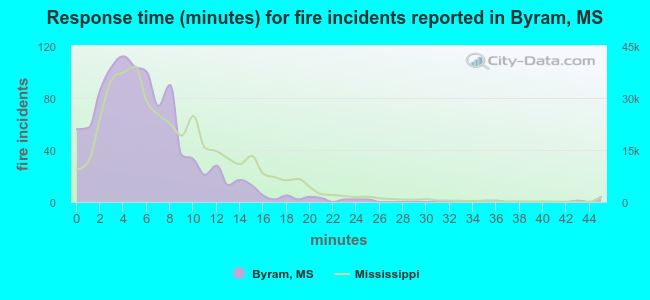 The median response time based on all reported fire incidents is 5 minutes. This is lower than the Mississippi median value.
The median response time in Byram, MS compared to nearest cities:
(Note: Based on data for all years, including only cities with at least 500 fire incidents)
| Byram: | 5 minutes |
| Terry: | 8 minutes |
| Richland: | 3 minutes |
| Florence: | 9 minutes |
| Jackson: | 5 minutes |
| Raymond: | 8 minutes |
| Clinton: | 5 minutes |
| Pearl: | 4 minutes |
| Flowood: | 4 minutes |
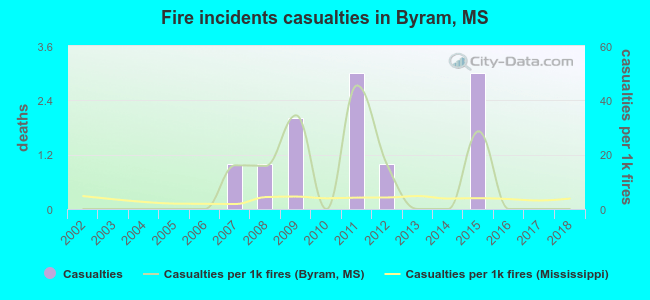 Based on the reports from the years 2002 - 2018 the average number of fire-related yearly casualties is 1. The highest number of reported casualties - 3 took place in 2011, and the lowest - 0 in 2002. The data has a constant trend.
The average number of injuries per 1,000 fire incidents is 9. This indicator was the highest - 45 in 2011, and the lowest 0 in 2002. The trend for casualties per 1,000 fires is constant. Compared to the Mississippi value the number of casualties per 1,000 fires is much higher.
Based on the reports from the years 2002 - 2018 the average number of fire-related yearly casualties is 1. The highest number of reported casualties - 3 took place in 2011, and the lowest - 0 in 2002. The data has a constant trend.
The average number of injuries per 1,000 fire incidents is 9. This indicator was the highest - 45 in 2011, and the lowest 0 in 2002. The trend for casualties per 1,000 fires is constant. Compared to the Mississippi value the number of casualties per 1,000 fires is much higher.
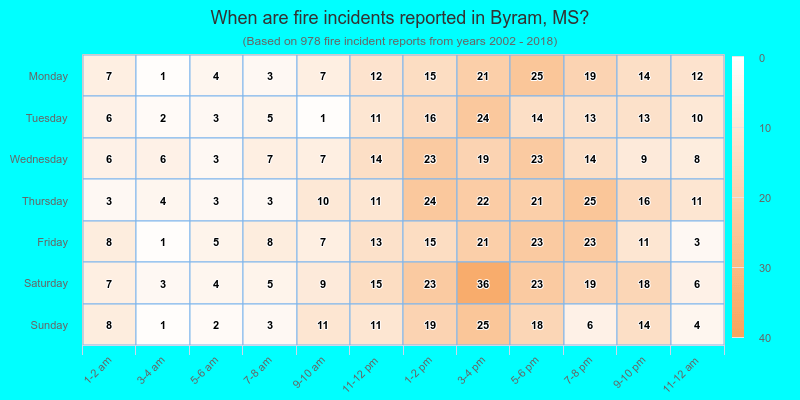
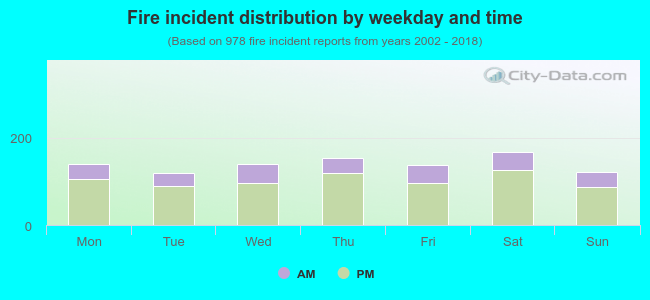 26.6% incidents where reported in the morning and 73.4% in the evening. The most fires (17.2%) took place on Saturday, and the least (12.1%) on Tuesday.
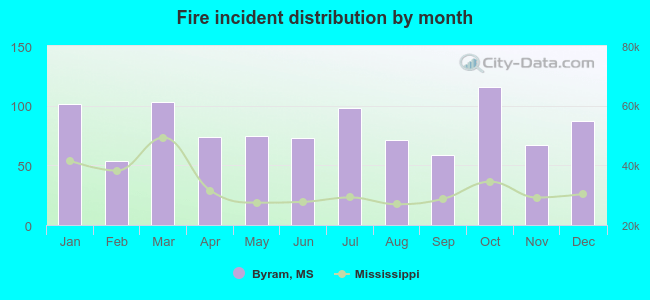 Based on the 978 reports from years 2002 - 2018 most fires (11.9%) took place during October, and the least (5.5%) in February.
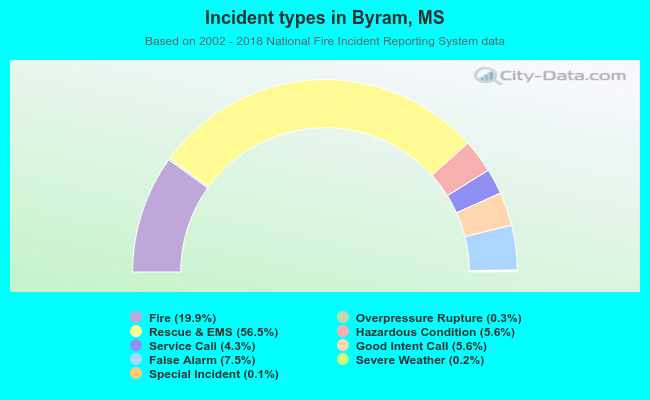 Out of all 4,926 cases reported during the years 2002 - 2018, the most belonged to the categories: Rescue & EMS (56.5%), Fire (19.9%), and False Alarm (7.5%).
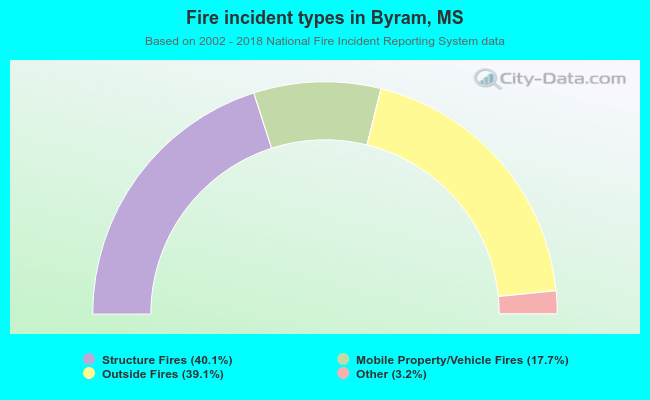 When looking into fire subcategories, the most reports belonged to: Structure Fires (40.1%), and Outside Fires (39.1%).