Carlsbad: Fire Incidents, New Mexico (NM)
Where are fire incidents reported in Carlsbad, NM
Something went wrong! Please refresh the page.
| Fire incidents reported | |
|---|---|
| Sreet name | Count |
| CANAL | 126 |
| PIERCE | 122 |
| CHURCH | 106 |
| CANAL CR206 | 86 |
| GREENE | 72 |
| 285 HWY | 68 |
| CANAL ST | 62 |
| HALAGUENO | 54 |
| 5TH | 46 |
| WOOD | 46 |
| BLACK RIVER VILLAGE RD | 44 |
| NATIONAL PARKS | 44 |
| STANDPIPE | 44 |
| 62/180 HWY | 42 |
| 62180 HWY | 42 |
| MAIN | 42 |
| GUADALUPE | 40 |
| ALAMEDA | 38 |
| ORCHARD | 38 |
| 6TH | 36 |
| MERMOD | 36 |
| LEA | 34 |
| TEXAS | 34 |
| BOYD | 32 |
| SAN JOSE | 32 |
| DERRICK RD | 28 |
| GRANDI RD | 28 |
| MESQUITE | 28 |
| RIVERSIDE | 28 |
| CANYON | 26 |
| Other | 1,712 |
2004 - 2018 National Fire Incident Reporting System (NFIRS) incidents
- Incident types reported to NFIRS in Carlsbad, NM
- 3,21655.7%Fire
- 1,17620.4%Hazardous Condition
- 5108.8%Rescue & EMS
- 4037.0%Good Intent Call
- 2814.9%False Alarm
- 1672.9%Service Call
- 110.2%Overpressure Rupture
- 90.2%Special Incident
- Fire incident types reported to NFIRS in Carlsbad, NM
- 1,78855.6%Outside Fires
- 80625.1%Structure Fires
- 38612.0%Mobile Property/Vehicle Fires
- 2367.3%Other
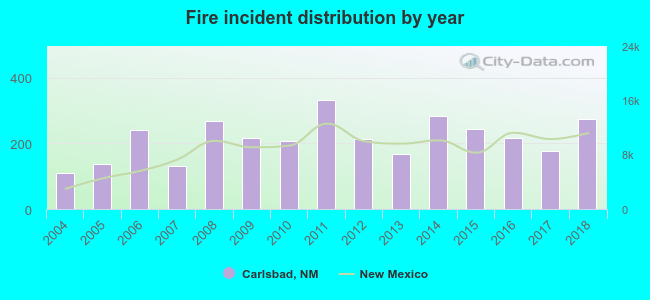 Based on the data from the years 2004 - 2018 the average number of fire incidents per year is 214. The highest number of fires - 331 took place in 2011, and the least - 110 in 2004. The data has a growing trend.
 The median response time based on all reported fire incidents is 5 minutes. This is lower compared to the New Mexico median value.
 According to the data from the years 2004 - 2018 the average number of fire-related fatalities per year is 1. The highest number of deaths - 5 took place in 2018, and the lowest - 0 in 2004. The data has a rising trend.
The average number of deaths per 1,000 fire incidents is 4. This indicator was the highest - 18 in 2016, and the lowest 0 in 2004. The trend for deaths per 1,000 incidents is growing. Compared to the state value the number of deaths per 1,000 incidents is much higher.
According to the data from the years 2004 - 2018 the average number of fire-related fatalities per year is 1. The highest number of deaths - 5 took place in 2018, and the lowest - 0 in 2004. The data has a rising trend.
The average number of deaths per 1,000 fire incidents is 4. This indicator was the highest - 18 in 2016, and the lowest 0 in 2004. The trend for deaths per 1,000 incidents is growing. Compared to the state value the number of deaths per 1,000 incidents is much higher.
 Based on the data from the years 2004 - 2018 the average number of fire-related casualties per year is 0. The highest number of reported injuries - 1 took place in 2004, and the lowest - 0 in 2005. The data has a decreasing trend.
The average number of injuries per 1,000 fire incidents is 2. This indicator was the highest - 9 in 2004, and the lowest 0 in 2005. The trend for injuries per 1,000 incidents is declining. Compared to the New Mexico value the number of injuries per 1,000 incidents is lower.
Based on the data from the years 2004 - 2018 the average number of fire-related casualties per year is 0. The highest number of reported injuries - 1 took place in 2004, and the lowest - 0 in 2005. The data has a decreasing trend.
The average number of injuries per 1,000 fire incidents is 2. This indicator was the highest - 9 in 2004, and the lowest 0 in 2005. The trend for injuries per 1,000 incidents is declining. Compared to the New Mexico value the number of injuries per 1,000 incidents is lower.
 32.8% incidents where reported in the morning and 67.2% in the evening. The most fires (15.5%) took place on Saturday, and the least (13.4%) on Thursday.
 According to the 3,216 incident reports from years 2004 - 2018 most fires (12.4%) took place during March, and the least (4.8%) in September.
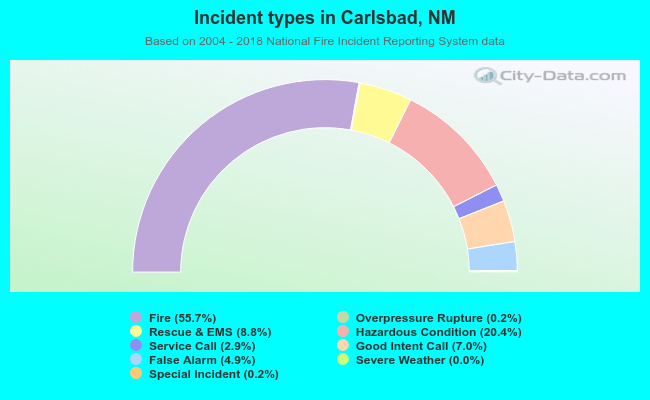 Out of all 5,775 cases reported during the years 2004 - 2018, the most belonged to the categories: Fire (55.7%), Hazardous Condition (20.4%), and Rescue & EMS (8.8%).
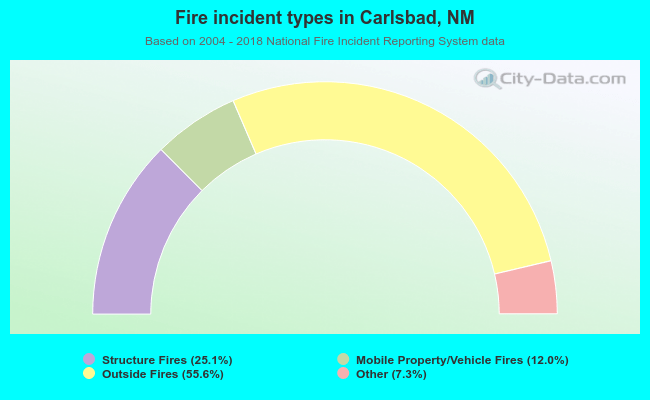 When looking into fire subcategories, the most reports belonged to: Outside Fires (55.6%), and Structure Fires (25.1%).