Columbia: Fire Incidents, Maryland (MD)
Where are fire incidents reported in Columbia, MD
Something went wrong! Please refresh the page.
| Fire incidents reported | |
|---|---|
| Sreet name | Count |
| LITTLE PATUXENT PKWY | 288 |
| STEVENS FOREST RD | 220 |
| HARPERS FARM RD | 182 |
| COLUMBIA RD | 164 |
| CEDAR LN | 154 |
| HICKORY RIDGE RD | 152 |
| TAMAR DR | 142 |
| CRADLEROCK WAY | 128 |
| OAKLAND MILLS RD | 92 |
| DOBBIN RD | 88 |
| GREEN MOUNTAIN CIR | 74 |
| SNOWDEN RIVER PKWY | 72 |
| COLUMBIA GATEWAY DR | 68 |
| BROOK WAY | 62 |
| CLOCKTOWER LN | 62 |
| HAYSHED LN | 62 |
| STANFORD BLVD | 62 |
| EDEN BROOK DR | 60 |
| COLUMBIA CROSSING CIR | 58 |
| GUILFORD RD | 58 |
| LITTLE PATUXENT | 58 |
| TURNABOUT LN | 58 |
| CLOUDLEAP CT | 56 |
| OAK HALL LN | 56 |
| THUNDER HILL RD | 54 |
| BASKET RING RD | 52 |
| TWIN RIVERS RD | 52 |
| WHITEACRE RD | 52 |
| KILIMANJARO RD | 48 |
| ELIOTS OAK RD | 46 |
| Other | 1,090 |
2002 - 2018 National Fire Incident Reporting System (NFIRS) incidents
- Incident types reported to NFIRS in Columbia, MD
- 48,57167.4%Rescue & EMS
- 6,2798.7%Good Intent Call
- 5,3957.5%Hazardous Condition
- 4,6816.5%False Alarm
- 3,8705.4%Fire
- 3,0614.2%Service Call
- 790.1%Special Incident
- Fire incident types reported to NFIRS in Columbia, MD
- 1,71044.2%Structure Fires
- 1,55440.2%Outside Fires
- 55914.4%Mobile Property/Vehicle Fires
- 471.2%Other
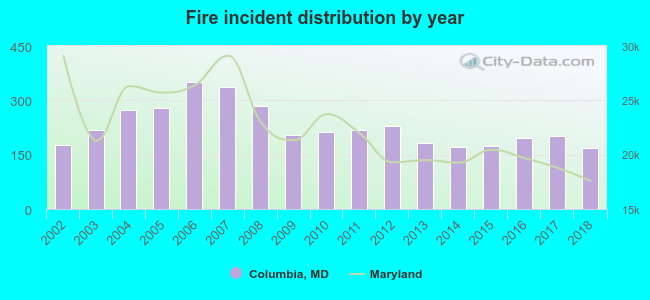 Based on the data from the years 2002 - 2018 the average number of fires per year is 228. The highest number of fire incidents - 350 took place in 2006, and the least - 169 in 2018. The data has a decreasing trend.
The average number of yearly fire incidents per 10k residents in Columbia, MD compared to nearest cities:
(Note: Based on data for the last 3 years, including only cities with population 5,000 and above)
| Columbia: | 18.9 |
| Scaggsville: | 0.4 |
| Ellicott City: | 18.3 |
| Savage: | 11.8 |
| Elkridge: | 60.5 |
| Jessup: | 52.3 |
| Laurel: | 61.4 |
| Burtonsville: | 30.0 |
| Maryland City: | 5.2 |
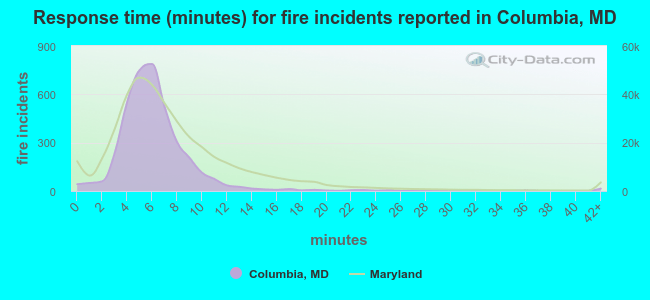 The median response time based on all reported fire incidents is 6 minutes. This is similar to the state median value.
The median response time in Columbia, MD compared to nearest cities:
(Note: Based on data for all years, including only cities with at least 500 fire incidents)
| Columbia: | 6 minutes |
| Ellicott City: | 7 minutes |
| Elkridge: | 7 minutes |
| Jessup: | 7 minutes |
| Laurel: | 7 minutes |
| Catonsville: | 5 minutes |
| Arbutus: | 5 minutes |
| Severn: | 7 minutes |
| Beltsville: | 6 minutes |
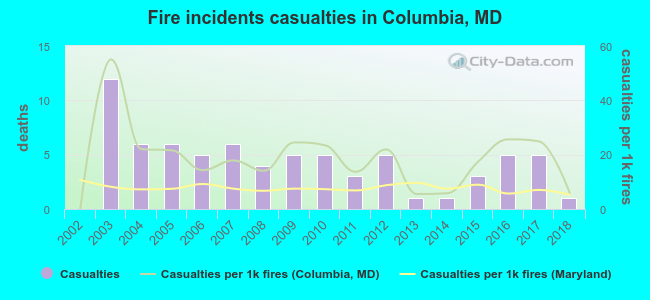 According to the reports from the years 2002 - 2018 the average number of fire-related casualties per year is 4. The highest number of casualties - 12 took place in 2003, and the lowest - 0 in 2002. The data has a growing trend.
The average number of injuries per 1,000 fire incidents is 18. This indicator was the highest - 55 in 2003, and the lowest 0 in 2002. The trend for injuries per 1,000 fires is growing. Compared to the Maryland value the number of injuries per 1,000 fires is much higher.
According to the reports from the years 2002 - 2018 the average number of fire-related casualties per year is 4. The highest number of casualties - 12 took place in 2003, and the lowest - 0 in 2002. The data has a growing trend.
The average number of injuries per 1,000 fire incidents is 18. This indicator was the highest - 55 in 2003, and the lowest 0 in 2002. The trend for injuries per 1,000 fires is growing. Compared to the Maryland value the number of injuries per 1,000 fires is much higher.Casualties per 1,000 incidents in Columbia, MD compared to nearest cities:
(Note: Based on data for all years, including only cities with at least 500 fire incidents)
| Columbia: | 18.9 |
| Ellicott City: | 15.5 |
| Elkridge: | 10.2 |
| Jessup: | 8.5 |
| Laurel: | 14.5 |
| Catonsville: | 3.5 |
| Arbutus: | 1.5 |
| Severn: | 20.7 |
| Beltsville: | 10.0 |
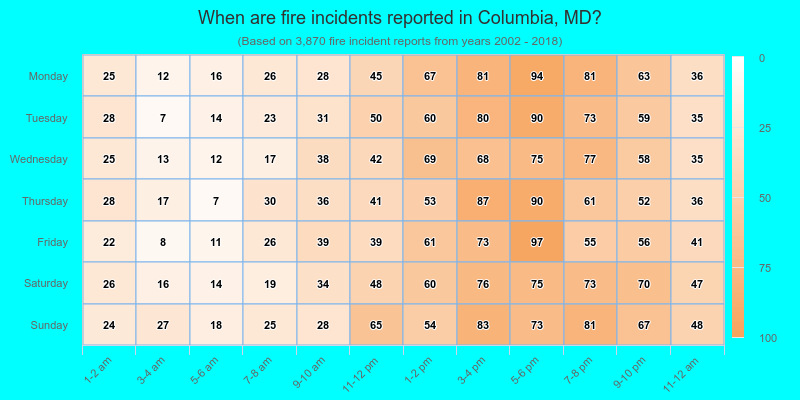
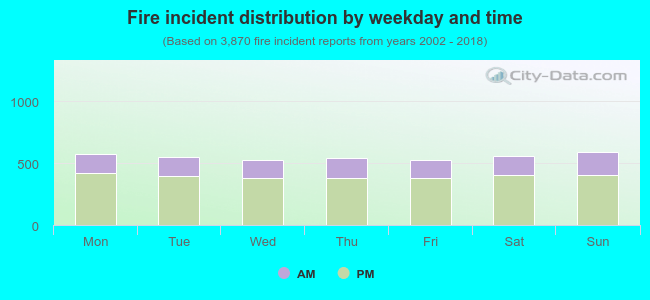 28.4% incidents where reported in the morning and 71.6% in the evening. The most fires (15.3%) took place on Sunday, and the least (13.6%) on Friday.
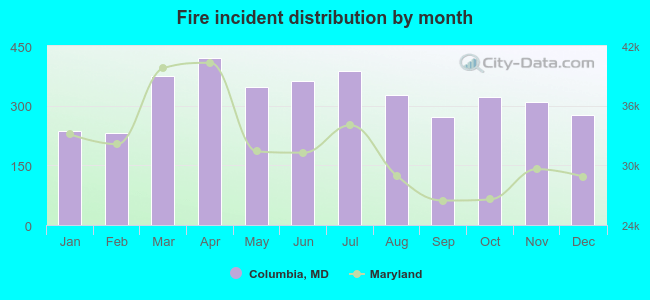 According to the 3,870 reports from years 2002 - 2018 most fires (10.9%) took place during April, and the least (6.0%) in February.
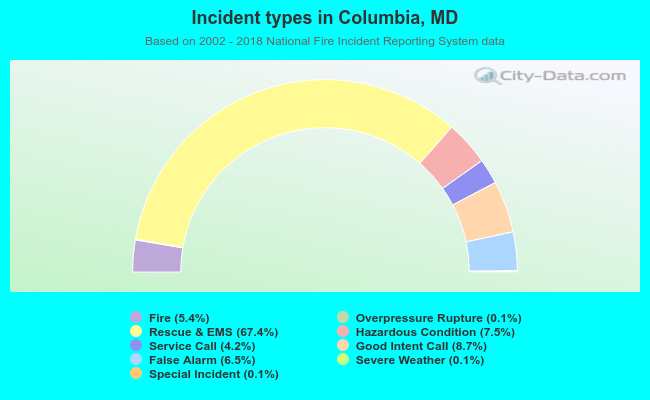 Out of all 72,044 cases reported during the years 2002 - 2018, the most belonged to the categories: Rescue & EMS (67.4%), Good Intent Call (8.7%), and Hazardous Condition (7.5%).
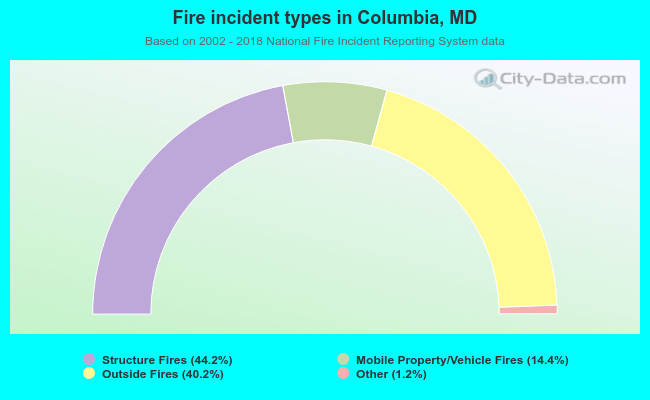 When looking into fire subcategories, the most incidents belonged to: Structure Fires (44.2%), and Outside Fires (40.2%).