Dickinson: Fire Incidents, Texas (TX)
Where are fire incidents reported in Dickinson, TX
Something went wrong! Please refresh the page.
| Fire incidents reported | |
|---|---|
| Sreet name | Count |
| DEATS (100-2198 EVEN) RD | 56 |
| DEATS RD | 54 |
| BAKER DR | 50 |
| I 45 (3003-3897 ODD) HWY | 50 |
| I 45 (2500-3898 EVEN) HWY | 44 |
| 25TH ST | 42 |
| FM 1266 FM | 42 |
| FM 517 | 38 |
| FM 517 (100-2299) FM | 38 |
| D AVE | 36 |
| LOBIT DR | 36 |
| FM 646 | 34 |
| 30TH ST | 30 |
| TANGLEWOOD DR | 30 |
| FM 517 (100-400) FM | 26 |
| HUGHES LANE | 24 |
| 44TH ST | 22 |
| ST HWY 3 (3500-5000) HWY | 22 |
| DEATS (2700-2998 EVEN) RD | 20 |
| DICKINSON AVE | 20 |
| HUGHES (100-2999) RD | 20 |
| I 45 (2501-3001 ODD) HWY | 20 |
| NICHOLS (900-2999) | 20 |
| 23RD ST | 18 |
| 28TH ST | 18 |
| 33RD ST | 18 |
| CALIFORNIA(2600-4099ODD) AVE | 18 |
| FM 517 (3100-5204 EVEN) FM | 18 |
| FM 517 (5205-6999 ODD) FM | 18 |
| SH 3 | 18 |
| Other | 758 |
2002 - 2018 National Fire Incident Reporting System (NFIRS) incidents
- Incident types reported to NFIRS in Dickinson, TX
- 1,77528.1%Hazardous Condition
- 1,65826.3%Fire
- 1,24019.7%Rescue & EMS
- 89814.2%Good Intent Call
- 3725.9%False Alarm
- 3345.3%Service Call
- 200.3%Overpressure Rupture
- Fire incident types reported to NFIRS in Dickinson, TX
- 68541.3%Outside Fires
- 61537.1%Structure Fires
- 28617.2%Mobile Property/Vehicle Fires
- 724.3%Other
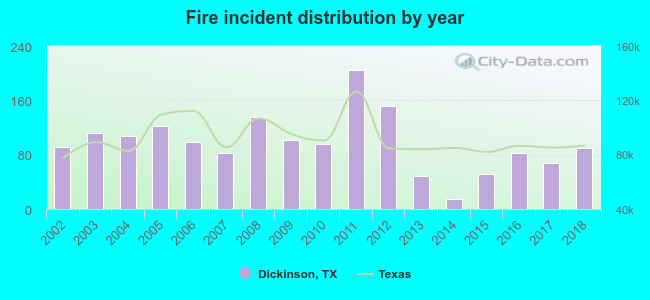 Based on the data from the years 2002 - 2018 the average number of fire incidents per year is 98. The highest number of reported fires - 205 took place in 2011, and the least - 14 in 2014. The data has a declining trend.
The average number of yearly fire incidents per 10k residents in Dickinson, TX compared to nearest cities:
(Note: Based on data for the last 3 years, including only cities with population 5,000 and above)
| Dickinson: | 40.8 |
| League City: | 15.7 |
| Bacliff: | 40.6 |
| Santa Fe: | 71.3 |
| Webster: | 63.6 |
| Seabrook: | 13.6 |
| La Marque: | 41.9 |
| Texas City: | 44.2 |
| Hitchcock: | 44.3 |
 The median response time based on all reported fire incidents is 6 minutes. This is close to the state median value.
The median response time in Dickinson, TX compared to nearest cities:
(Note: Based on data for all years, including only cities with at least 500 fire incidents)
| Dickinson: | 6 minutes |
| League City: | 7 minutes |
| Santa Fe: | 7 minutes |
| Webster: | 5 minutes |
| Seabrook: | 8 minutes |
| La Marque: | 5 minutes |
| Texas City: | 6 minutes |
| Hitchcock: | 8 minutes |
| Friendswood: | 5 minutes |
 Based on the data from the years 2002 - 2018 the average number of fire-related casualties per year is 1. The highest number of injuries - 5 took place in 2002, and the lowest - 0 in 2004. The data has a decreasing trend.
The average number of casualties per 1,000 fire incidents is 11. This indicator was the highest - 55 in 2002, and the lowest 0 in 2004. The trend for casualties per 1,000 incidents is declining. Compared to the state value the number of injuries per 1,000 fire incidents is higher.
Based on the data from the years 2002 - 2018 the average number of fire-related casualties per year is 1. The highest number of injuries - 5 took place in 2002, and the lowest - 0 in 2004. The data has a decreasing trend.
The average number of casualties per 1,000 fire incidents is 11. This indicator was the highest - 55 in 2002, and the lowest 0 in 2004. The trend for casualties per 1,000 incidents is declining. Compared to the state value the number of injuries per 1,000 fire incidents is higher.Casualties per 1,000 incidents in Dickinson, TX compared to nearest cities:
(Note: Based on data for all years, including only cities with at least 500 fire incidents)
| Dickinson: | 11.5 |
| League City: | 10.1 |
| Santa Fe: | 2.9 |
| Webster: | 10.9 |
| Seabrook: | 3.6 |
| La Marque: | 10.2 |
| Texas City: | 4.2 |
| Hitchcock: | 1.3 |
| Friendswood: | 11.9 |
 30.4% incidents where reported in the morning and 69.6% in the evening. The most fires (16.9%) took place on Saturday, and the least (12.3%) on Sunday.
 According to the 1,658 fire incident reports from years 2002 - 2018 most fires (9.9%) took place during January, and the least (6.8%) in June.
 Out of all 6,308 cases reported during the years 2002 - 2018, the most belonged to the categories: Hazardous Condition (28.1%), Fire (26.3%), and Rescue & EMS (19.7%).
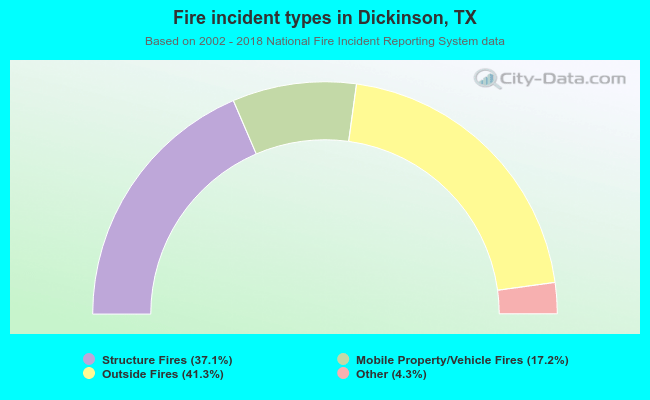 When looking into fire subcategories, the most incidents belonged to: Outside Fires (41.3%), and Structure Fires (37.1%).