Fishersville: Fire Incidents, Virginia (VA)
Where are fire incidents reported in Fishersville, VA
Something went wrong! Please refresh the page.
|
| |||||||||||||||||||||||||||||||||||||||||||||||||||||||||||||||||||||||||||||||||||||||||||||||||||||||||||||
2002 - 2018 National Fire Incident Reporting System (NFIRS) incidents
- Incident types reported to NFIRS in Fishersville, VA
- 1,20832.7%Rescue & EMS
- 75320.4%Good Intent Call
- 54114.6%Hazardous Condition
- 53614.5%Fire
- 39010.6%False Alarm
- 2386.4%Service Call
- 130.4%Special Incident
- 120.3%Overpressure Rupture
- Fire incident types reported to NFIRS in Fishersville, VA
- 28152.4%Structure Fires
- 13725.6%Outside Fires
- 9417.5%Mobile Property/Vehicle Fires
- 244.5%Other
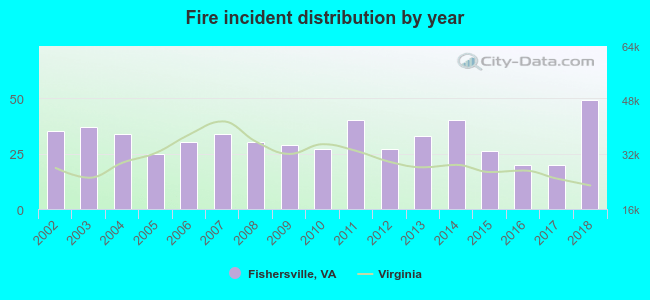 According to the data from the years 2002 - 2018 the average number of fire incidents per year is 32. The highest number of fire incidents - 49 took place in 2018, and the least - 20 in 2016. The data has a growing trend.
The average number of yearly fire incidents per 10k residents in Fishersville, VA compared to nearest cities:
(Note: Based on data for the last 3 years, including only cities with population 5,000 and above)
| Fishersville: | 39.8 |
| Waynesboro: | 53.7 |
| Stuarts Draft: | 41.9 |
| Staunton: | 46.5 |
| Crozet: | 24.0 |
| Bridgewater: | 29.7 |
| Harrisonburg: | 17.0 |
| Charlottesville: | 70.8 |
| Buena Vista: | 75.7 |
 The median response time based on all reported fire incidents is 8 minutes. This is about the same as the Virginia median value.
The median response time in Fishersville, VA compared to nearest cities:
(Note: Based on data for all years, including only cities with at least 500 fire incidents)
| Fishersville: | 8 minutes |
| Waynesboro: | 7 minutes |
| Stuarts Draft: | 11 minutes |
| Verona: | 9 minutes |
| Staunton: | 7 minutes |
| Greenville: | 15 minutes |
| Churchville: | 12 minutes |
| Grottoes: | 9 minutes |
| Bridgewater: | 11 minutes |
 34.5% incidents where reported in the morning and 65.5% in the evening. The most fires (16.8%) took place on Wednesday, and the least (11.0%) on Sunday.
 Based on the 536 incident reports from years 2002 - 2018 most fires (17.0%) took place during January, and the least (4.3%) in October.
 Out of all 3,694 cases reported during the years 2002 - 2018, the most belonged to the categories: Rescue & EMS (32.7%), Good Intent Call (20.4%), and Hazardous Condition (14.6%).
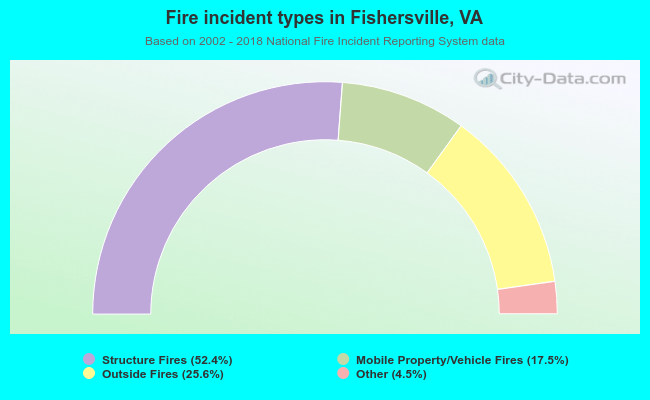 When looking into fire subcategories, the most incidents belonged to: Structure Fires (52.4%), and Outside Fires (25.6%).