Flat Rock: Fire Incidents, Michigan (MI)
Where are fire incidents reported in Flat Rock, MI
Something went wrong! Please refresh the page.
|
| |||||||||||||||||||||||||||||||||||||||||||||||||||||||||||||||||||||||||||||||||||||||||||||||||||||||||||||
2002 - 2018 National Fire Incident Reporting System (NFIRS) incidents
- Incident types reported to NFIRS in Flat Rock, MI
- 5,04183.0%Rescue & EMS
- 3075.1%Fire
- 2584.2%Hazardous Condition
- 1853.0%Service Call
- 1422.3%Good Intent Call
- 1342.2%False Alarm
- Fire incident types reported to NFIRS in Flat Rock, MI
- 18359.6%Structure Fires
- 6420.8%Outside Fires
- 4514.7%Mobile Property/Vehicle Fires
- 154.9%Other
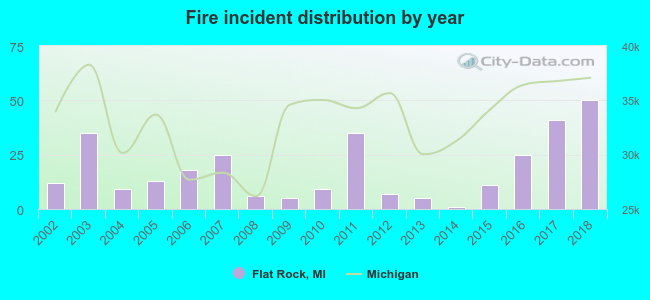 According to the data from the years 2002 - 2018 the average number of fire incidents per year is 18. The highest number of reported fires - 50 took place in 2018, and the least - 1 in 2014. The data has a rising trend.
The average number of yearly fire incidents per 10k residents in Flat Rock, MI compared to nearest cities:
(Note: Based on data for the last 3 years, including only cities with population 5,000 and above)
| Flat Rock: | 39.2 |
| Woodhaven: | 25.9 |
| Trenton: | 15.6 |
| Grosse Ile: | 12.7 |
| Riverview: | 31.4 |
| Southgate: | 18.0 |
| Taylor: | 28.1 |
| Wyandotte: | 23.3 |
| Romulus: | 49.8 |
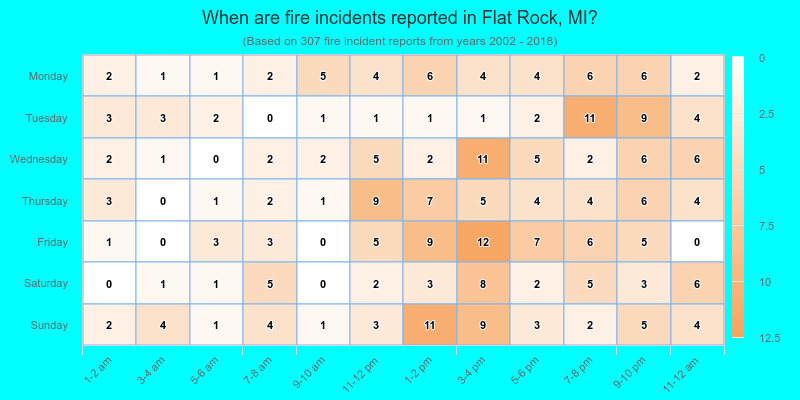
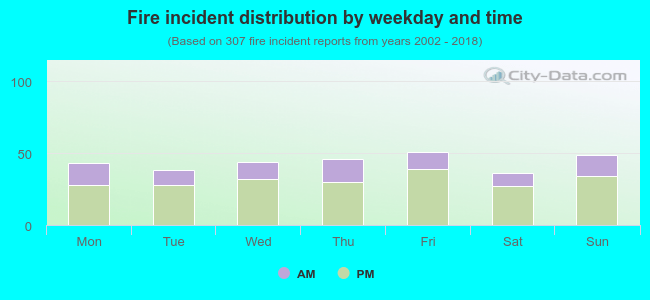 29.0% incidents where reported in the morning and 71.0% in the evening. The most fires (16.6%) took place on Friday, and the least (11.7%) on Saturday.
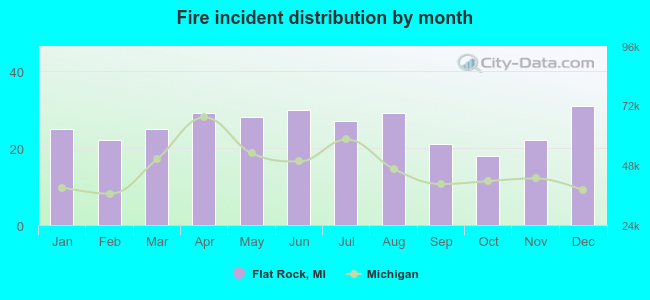 Based on the 307 reports from years 2002 - 2018 most fires (10.1%) took place during December, and the least (5.9%) in October.
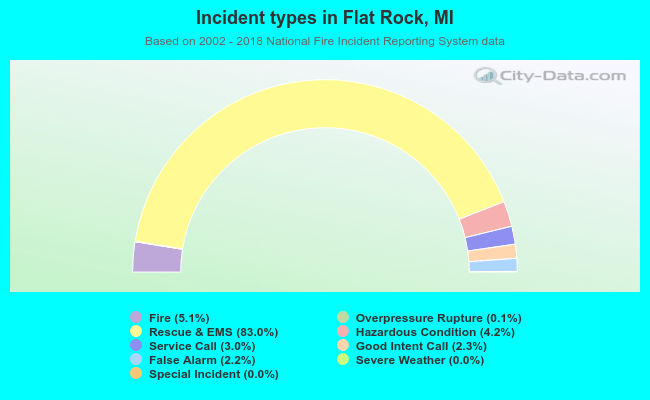 Out of all 6,075 cases reported during the years 2002 - 2018, the most belonged to the categories: Rescue & EMS (83.0%), Fire (5.1%), and Hazardous Condition (4.2%).
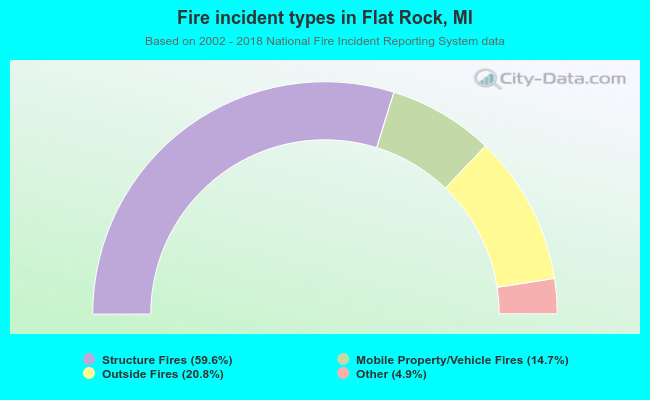 When looking into fire subcategories, the most reports belonged to: Structure Fires (59.6%), and Outside Fires (20.8%).