Frankfort: Fire Incidents, Illinois (IL)
Where are fire incidents reported in Frankfort, IL
Something went wrong! Please refresh the page.
| Fire incidents reported | |
|---|---|
| Sreet name | Count |
| LINCOLN HWY | 196 |
| LAGRANGE RD | 154 |
| CENTER RD | 84 |
| ST FRANCIS RD | 74 |
| FRANKFORT SQUARE RD | 62 |
| LARAWAY RD | 56 |
| HARLEM AVE | 48 |
| NEBRASKA ST | 46 |
| 80TH AVE | 44 |
| DRALLE RD | 42 |
| STEGER RD | 40 |
| STUENKEL RD | 40 |
| MANHATTAN MONEE RD | 34 |
| KINGSTON DR | 32 |
| NEBRASKA | 30 |
| NORTH AVE | 30 |
| 88TH AVE | 28 |
| 84TH AVE | 26 |
| LA GRANGE RD | 26 |
| PINE HILL RD | 26 |
| 104TH AVE | 24 |
| SYCAMORE LN | 24 |
| SAUK TRL | 22 |
| BRICKSTONE DR | 20 |
| PRESTWICK DR | 20 |
| 78TH AVE | 18 |
| ABERDEEN RD | 18 |
| LAMBRECHT RD | 18 |
| ROSEWOOD DR | 18 |
| 80TH | 16 |
| Other | 187 |
2002 - 2018 National Fire Incident Reporting System (NFIRS) incidents
- Incident types reported to NFIRS in Frankfort, IL
- 8,57247.1%Rescue & EMS
- 3,21917.7%False Alarm
- 2,27512.5%Service Call
- 1,5038.3%Fire
- 1,4948.2%Hazardous Condition
- 1,0725.9%Good Intent Call
- 410.2%Special Incident
- Fire incident types reported to NFIRS in Frankfort, IL
- 61941.2%Structure Fires
- 59439.5%Outside Fires
- 17211.4%Mobile Property/Vehicle Fires
- 1187.9%Other
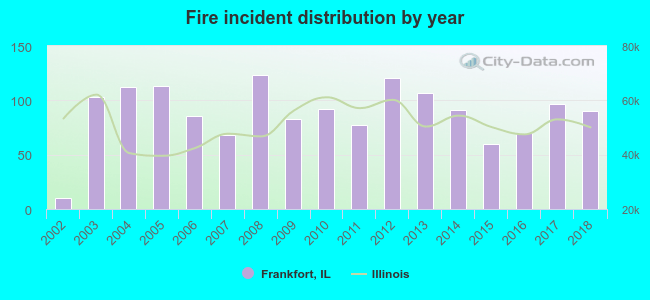 According to the data from the years 2002 - 2018 the average number of fire incidents per year is 88. The highest number of fires - 123 took place in 2008, and the least - 10 in 2002. The data has a rising trend.
The average number of yearly fire incidents per 10k residents in Frankfort, IL compared to nearest cities:
(Note: Based on data for the last 3 years, including only cities with population 5,000 and above)
| Frankfort: | 46.4 |
| Mokena: | 44.2 |
| Tinley Park: | 26.4 |
| Matteson: | 55.2 |
| Orland Hills: | 24.7 |
| New Lenox: | 36.1 |
| Richton Park: | 46.3 |
| Monee: | 131.9 |
| Orland Park: | 22.6 |
 The median response time based on all reported fire incidents is 6 minutes. This is about the same as the Illinois median value.
The median response time in Frankfort, IL compared to nearest cities:
(Note: Based on data for all years, including only cities with at least 500 fire incidents)
| Frankfort: | 6 minutes |
| Mokena: | 6 minutes |
| Tinley Park: | 6 minutes |
| Matteson: | 6 minutes |
| New Lenox: | 6 minutes |
| Richton Park: | 6 minutes |
| Monee: | 6 minutes |
| Orland Park: | 5 minutes |
| Country Club Hills: | 5 minutes |
 Based on the data from the years 2002 - 2018 the average number of fire-related casualties per year is 1. The highest number of injuries - 3 took place in 2005, and the lowest - 0 in 2002. The data has a constant trend.
The average number of casualties per 1,000 fire incidents is 5. This indicator was the highest - 27 in 2005, and the lowest 0 in 2002. The trend for casualties per 1,000 incidents is increasing. Compared to the Illinois value the number of injuries per 1,000 fires is lower.
Based on the data from the years 2002 - 2018 the average number of fire-related casualties per year is 1. The highest number of injuries - 3 took place in 2005, and the lowest - 0 in 2002. The data has a constant trend.
The average number of casualties per 1,000 fire incidents is 5. This indicator was the highest - 27 in 2005, and the lowest 0 in 2002. The trend for casualties per 1,000 incidents is increasing. Compared to the Illinois value the number of injuries per 1,000 fires is lower.Casualties per 1,000 incidents in Frankfort, IL compared to nearest cities:
(Note: Based on data for all years, including only cities with at least 500 fire incidents)
| Frankfort: | 6.0 |
| Mokena: | 3.4 |
| Tinley Park: | 4.7 |
| Matteson: | 21.6 |
| New Lenox: | 3.6 |
| Richton Park: | 6.1 |
| Monee: | 3.9 |
| Orland Park: | 12.9 |
| Country Club Hills: | 6.0 |
 31.5% incidents where reported in the morning and 68.5% in the evening. The most fires (17.8%) took place on Saturday, and the least (11.4%) on Friday.
 According to the 1,503 reports from years 2002 - 2018 most fires (13.2%) took place during July, and the least (4.8%) in December.
 Out of all 18,195 cases reported during the years 2002 - 2018, the most belonged to the categories: Rescue & EMS (47.1%), False Alarm (17.7%), and Service Call (12.5%).
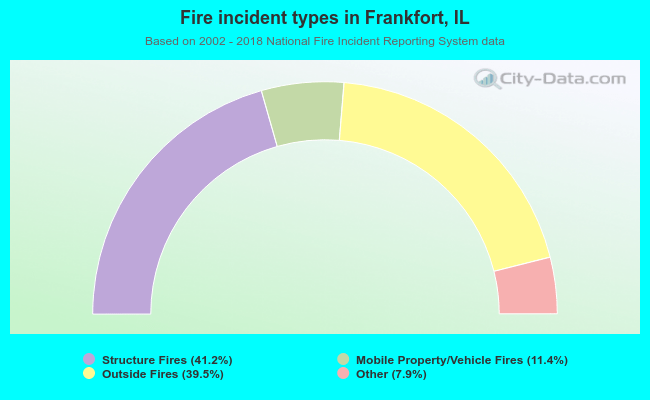 When looking into fire subcategories, the most reports belonged to: Structure Fires (41.2%), and Outside Fires (39.5%).