Galena Park: Fire Incidents, Texas (TX)
Where are fire incidents reported in Galena Park, TX
Something went wrong! Please refresh the page.
|
| |||||||||||||||||||||||||||||||||||||||||||||||||||||||||||||||||||||||||||||||||||||||||||||||||||||||||||||
2003 - 2018 National Fire Incident Reporting System (NFIRS) incidents
- Incident types reported to NFIRS in Galena Park, TX
- 2,54374.4%Rescue & EMS
- 38511.3%Fire
- 2467.2%Hazardous Condition
- 962.8%False Alarm
- 802.3%Service Call
- 611.8%Good Intent Call
- 60.2%Special Incident
- Fire incident types reported to NFIRS in Galena Park, TX
- 17846.2%Structure Fires
- 10527.3%Outside Fires
- 5714.8%Other
- 4511.7%Mobile Property/Vehicle Fires
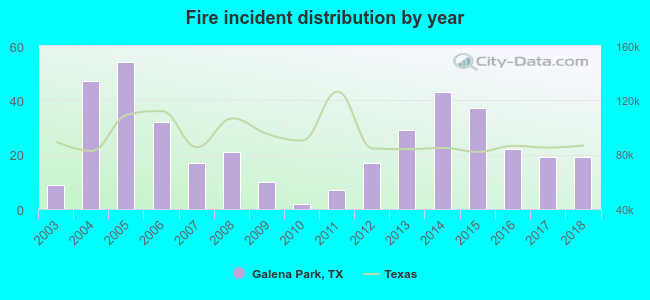 According to the data from the years 2003 - 2018 the average number of fires per year is 24. The highest number of fires - 54 took place in 2005, and the least - 2 in 2010. The data has a rising trend.
The average number of yearly fire incidents per 10k residents in Galena Park, TX compared to nearest cities:
(Note: Based on data for the last 3 years, including only cities with population 5,000 and above)
| Galena Park: | 17.9 |
| Jacinto City: | 2.5 |
| Cloverleaf: | 0.6 |
| South Houston: | 1.1 |
| Pasadena: | 10.7 |
| Channelview: | 55.4 |
| Deer Park: | 13.1 |
| Houston: | 33.1 |
| Highlands: | 192.3 |

 36.9% incidents where reported in the morning and 63.1% in the evening. The most fires (16.4%) took place on Tuesday, and the least (11.2%) on Saturday.
 According to the 385 incident reports from years 2003 - 2018 most fires (16.4%) took place during January, and the least (5.7%) in March.
 Out of all 3,420 cases reported during the years 2003 - 2018, the most belonged to the categories: Rescue & EMS (74.4%), Fire (11.3%), and Hazardous Condition (7.2%).
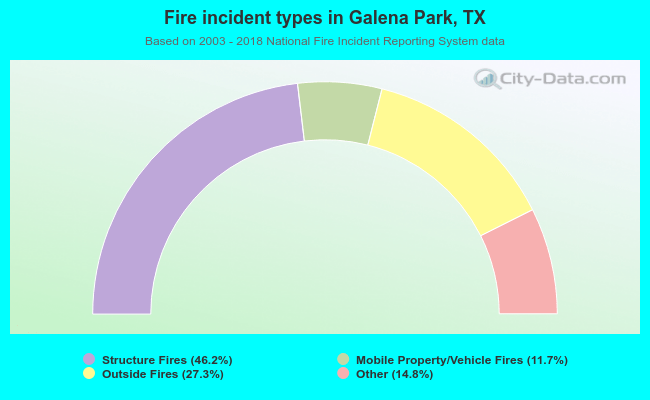 When looking into fire subcategories, the most reports belonged to: Structure Fires (46.2%), and Outside Fires (27.3%).