Granite City: Fire Incidents, Illinois (IL)
Where are fire incidents reported in Granite City, IL
Something went wrong! Please refresh the page.
| Fire incidents reported | |
|---|---|
| Sreet name | Count |
| NAMEOKI RD | 186 |
| MADISON AVE | 166 |
| WASHINGTON AVE | 120 |
| STATE ST | 114 |
| EDISON AVE | 112 |
| BENTON ST | 108 |
| IOWA ST | 102 |
| MISSOURI AVE | 102 |
| GRAND AVE | 100 |
| 25TH ST | 94 |
| EDWARDSVILLE RD | 90 |
| DELMAR AVE | 84 |
| PONTOON RD | 80 |
| NIEDRINGHAUS AVE | 78 |
| 24TH ST | 76 |
| ADAMS ST | 76 |
| CLEVELAND BLVD | 70 |
| MARYVILLE RD | 66 |
| 23RD ST | 64 |
| EDWARDS ST | 64 |
| CENTURY DR | 60 |
| 20TH ST | 52 |
| LINCOLN AVE | 50 |
| BUXTON AVE | 48 |
| CENTER ST | 48 |
| ILLINOIS AVE | 48 |
| LEE AVE | 44 |
| BRYAN AVE | 42 |
| CHAIN OF ROCKS RD | 38 |
| SHERIDAN | 38 |
| Other | 99 |
2002 - 2018 National Fire Incident Reporting System (NFIRS) incidents
- Incident types reported to NFIRS in Granite City, IL
- 7,28451.4%Rescue & EMS
- 2,51917.8%Fire
- 1,90013.4%Hazardous Condition
- 9626.8%False Alarm
- 8966.3%Good Intent Call
- 5233.7%Service Call
- 550.4%Special Incident
- 290.2%Overpressure Rupture
- Fire incident types reported to NFIRS in Granite City, IL
- 96838.4%Outside Fires
- 92536.7%Structure Fires
- 36014.3%Mobile Property/Vehicle Fires
- 26610.6%Other
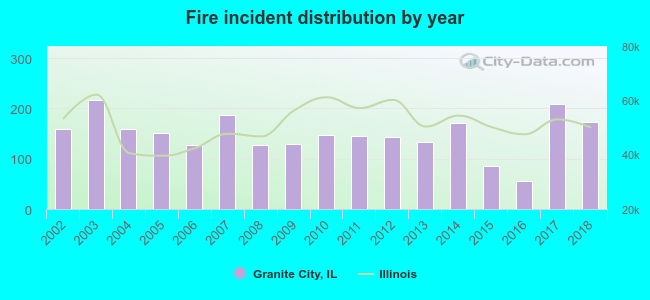 According to the data from the years 2002 - 2018 the average number of fires per year is 148. The highest number of reported fires - 216 took place in 2003, and the least - 56 in 2016. The data has a rising trend.
The average number of yearly fire incidents per 10k residents in Granite City, IL compared to nearest cities:
(Note: Based on data for the last 3 years, including only cities with population 5,000 and above)
| Granite City: | 49.8 |
| Pontoon Beach: | 67.6 |
| Collinsville: | 53.9 |
| Glen Carbon: | 17.8 |
| Maryville: | 3.8 |
| Centreville: | 233.1 |
| Wood River: | 55.0 |
| Edwardsville: | 34.3 |
| Cahokia: | 146.7 |
 The median response time based on all reported fire incidents is 3 minutes. This is lower compared to the Illinois median value.
The median response time in Granite City, IL compared to nearest cities:
(Note: Based on data for all years, including only cities with at least 500 fire incidents)
| Granite City: | 3 minutes |
| Madison: | 6 minutes |
| Pontoon Beach: | 7 minutes |
| Washington Park: | 5 minutes |
| East St. Louis: | 6 minutes |
| Collinsville: | 5 minutes |
| Caseyville: | 6 minutes |
| Alorton: | 5 minutes |
| Centreville: | 7 minutes |
 According to the reports from the years 2002 - 2018 the average number of fire-related yearly deaths is 0. The highest number of reported deaths - 2 took place in 2005, and the lowest - 0 in 2002. The data has a constant trend.
The average number of deaths per 1,000 fire incidents is 2. This indicator was the highest - 16 in 2008, and the lowest 0 in 2002. The trend for fatalities per 1,000 incidents is constant. Compared to the Illinois value the number of fatalities per 1,000 incidents is about the same.
According to the reports from the years 2002 - 2018 the average number of fire-related yearly deaths is 0. The highest number of reported deaths - 2 took place in 2005, and the lowest - 0 in 2002. The data has a constant trend.
The average number of deaths per 1,000 fire incidents is 2. This indicator was the highest - 16 in 2008, and the lowest 0 in 2002. The trend for fatalities per 1,000 incidents is constant. Compared to the Illinois value the number of fatalities per 1,000 incidents is about the same.
 According to the data from the years 2002 - 2018 the average number of fire-related yearly casualties is 3. The highest number of injuries - 8 took place in 2008, and the lowest - 0 in 2006. The data has a growing trend.
The average number of casualties per 1,000 fire incidents is 21. This indicator was the highest - 63 in 2008, and the lowest 0 in 2006. The trend for casualties per 1,000 fire incidents is increasing. Compared to the Illinois value the number of casualties per 1,000 incidents is higher.
According to the data from the years 2002 - 2018 the average number of fire-related yearly casualties is 3. The highest number of injuries - 8 took place in 2008, and the lowest - 0 in 2006. The data has a growing trend.
The average number of casualties per 1,000 fire incidents is 21. This indicator was the highest - 63 in 2008, and the lowest 0 in 2006. The trend for casualties per 1,000 fire incidents is increasing. Compared to the Illinois value the number of casualties per 1,000 incidents is higher.Casualties per 1,000 incidents in Granite City, IL compared to nearest cities:
(Note: Based on data for all years, including only cities with at least 500 fire incidents)
| Granite City: | 19.8 |
| Madison: | 2.0 |
| Pontoon Beach: | 2.2 |
| Washington Park: | 3.0 |
| East St. Louis: | 2.3 |
| Collinsville: | 16.9 |
| Caseyville: | 1.5 |
| Alorton: | 0.0 |
| Centreville: | 0.0 |
 33.7% incidents where reported in the morning and 66.3% in the evening. The most fires (16.1%) took place on Tuesday, and the least (12.9%) on Thursday.
 Based on the 2,519 fire incidents from years 2002 - 2018 most fires (10.0%) took place during March, and the least (6.2%) in December.
 Out of all 14,182 cases reported during the years 2002 - 2018, the most belonged to the categories: Rescue & EMS (51.4%), Fire (17.8%), and Hazardous Condition (13.4%).
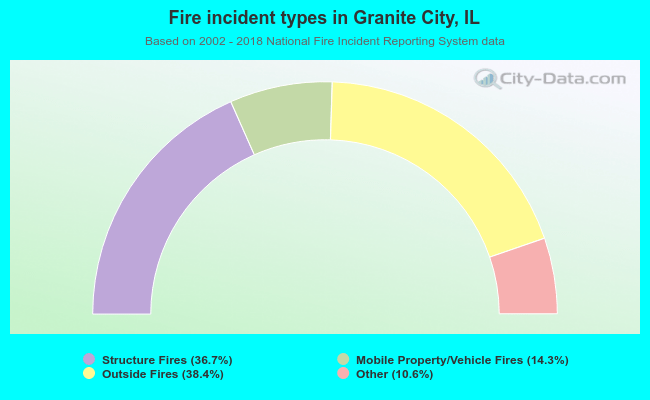 When looking into fire subcategories, the most incidents belonged to: Outside Fires (38.4%), and Structure Fires (36.7%).