Highland Park: Fire Incidents, Texas (TX)
Where are fire incidents reported in Highland Park, TX
Something went wrong! Please refresh the page.
|
| |||||||||||||||||||||||||||||||||||||||||||||||||||||||||||||||||||||||||||||||||||||||||||||||||||||||||||||
2004 - 2018 National Fire Incident Reporting System (NFIRS) incidents
- Incident types reported to NFIRS in Highland Park, TX
- 1,63529.4%Rescue & EMS
- 1,60228.8%Good Intent Call
- 1,14120.5%Hazardous Condition
- 91916.5%False Alarm
- 1953.5%Fire
- 631.1%Service Call
- 70.1%Severe Weather
- Fire incident types reported to NFIRS in Highland Park, TX
- 11860.5%Structure Fires
- 5025.6%Outside Fires
- 199.7%Mobile Property/Vehicle Fires
- 84.1%Other
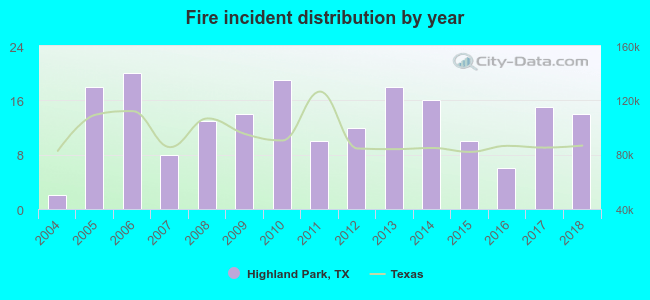 Based on the data from the years 2004 - 2018 the average number of fires per year is 13. The highest number of reported fire incidents - 20 took place in 2006, and the least - 2 in 2004. The data has a rising trend.
The average number of yearly fire incidents per 10k residents in Highland Park, TX compared to nearest cities:
(Note: Based on data for the last 3 years, including only cities with population 5,000 and above)
| Highland Park: | 13.0 |
| University Park: | 15.3 |
| Dallas: | 16.3 |
| Farmers Branch: | 29.3 |
| Addison: | 50.9 |
| Irving: | 21.8 |
| Richardson: | 18.0 |
| Garland: | 25.0 |
| Mesquite: | 31.4 |
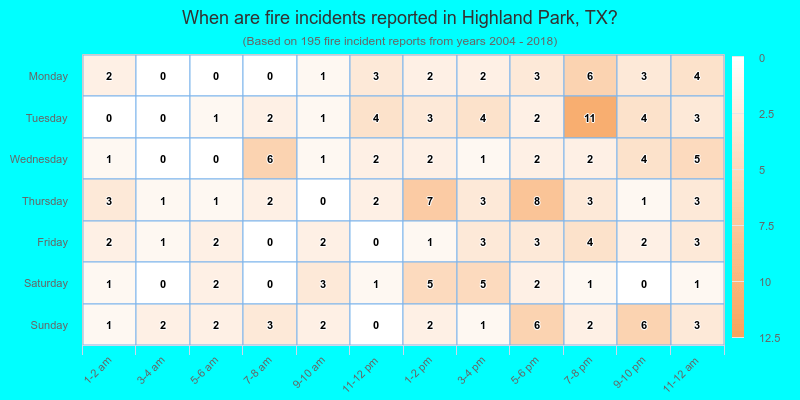
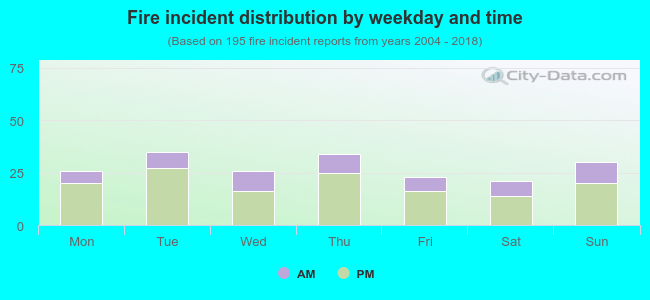 29.2% incidents where reported in the morning and 70.8% in the evening. The most fires (17.9%) took place on Tuesday, and the least (10.8%) on Saturday.
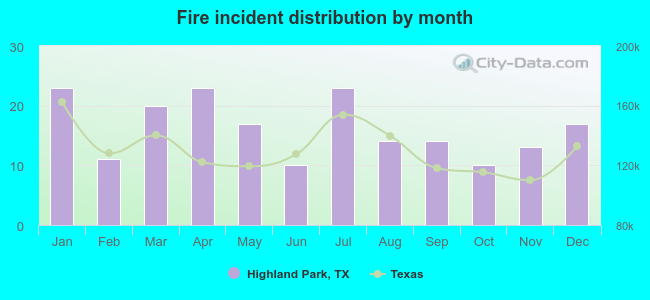 Based on the 195 incident reports from years 2004 - 2018 most fires (11.8%) took place during January, and the least (5.1%) in June.
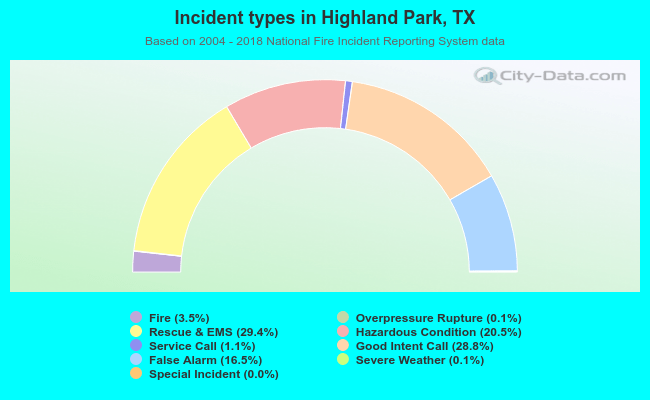 Out of all 5,566 cases reported during the years 2004 - 2018, the most belonged to the categories: Rescue & EMS (29.4%), Good Intent Call (28.8%), and Hazardous Condition (20.5%).
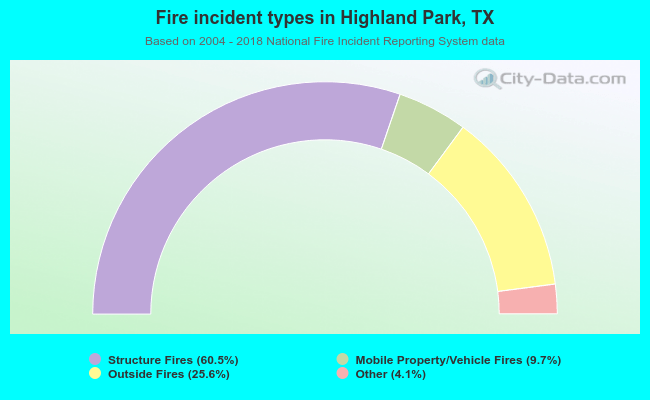 When looking into fire subcategories, the most incidents belonged to: Structure Fires (60.5%), and Outside Fires (25.6%).