Howell: Fire Incidents, Michigan (MI)
Where are fire incidents reported in Howell, MI
Something went wrong! Please refresh the page.
| Fire incidents reported | |
|---|---|
| Sreet name | Count |
| GRAND RIVER | 224 |
| GRAND RIVER AVE | 206 |
| HIGHLAND RD | 140 |
| LATSON RD | 128 |
| BYRON RD | 108 |
| I96 | 94 |
| OAK GROVE RD | 94 |
| I-96 EXPY | 92 |
| ALLEN RD | 88 |
| GOLF CLUB RD | 68 |
| ARGENTINE RD | 66 |
| COON LAKE RD | 60 |
| CLYDE RD | 58 |
| ASHEBURY LN | 52 |
| BURKHART RD | 48 |
| HUGHES RD | 46 |
| MASON RD | 46 |
| CHILSON RD | 40 |
| EAGER RD | 40 |
| MARR RD | 40 |
| PINCKNEY RD | 40 |
| JONES RD | 38 |
| MACK RD | 38 |
| PINGREE RD | 36 |
| FAUSSETT RD | 32 |
| NORTON RD | 30 |
| BERGIN RD | 28 |
| PEAVY RD | 28 |
| FISHER RD | 26 |
| HACKER RD | 26 |
| Other | 371 |
2002 - 2018 National Fire Incident Reporting System (NFIRS) incidents
- Incident types reported to NFIRS in Howell, MI
- 4,30231.6%Rescue & EMS
- 3,20023.5%Hazardous Condition
- 2,43117.8%Fire
- 1,98814.6%Good Intent Call
- 1,0827.9%False Alarm
- 5644.1%Service Call
- 390.3%Overpressure Rupture
- Fire incident types reported to NFIRS in Howell, MI
- 1,11545.9%Structure Fires
- 72529.8%Outside Fires
- 52521.6%Mobile Property/Vehicle Fires
- 662.7%Other
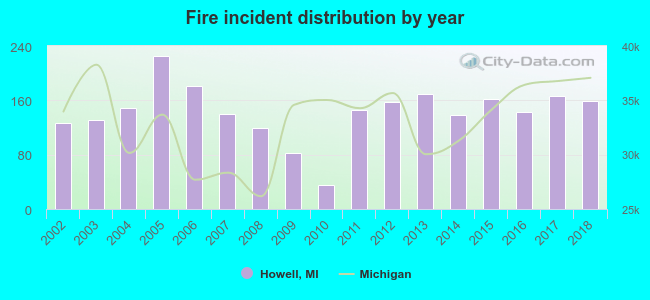 Based on the data from the years 2002 - 2018 the average number of fires per year is 143. The highest number of fires - 225 took place in 2005, and the least - 35 in 2010. The data has an increasing trend.
The average number of yearly fire incidents per 10k residents in Howell, MI compared to nearest cities:
(Note: Based on data for the last 3 years, including only cities with population 5,000 and above)
| Howell: | 162.9 |
| Brighton: | 156.3 |
| Whitmore Lake: | 81.0 |
| Milford: | 53.1 |
| Fenton: | 91.6 |
| South Lyon: | 54.9 |
| Holly: | 105.5 |
| Chelsea: | 85.7 |
| Wixom: | 23.8 |
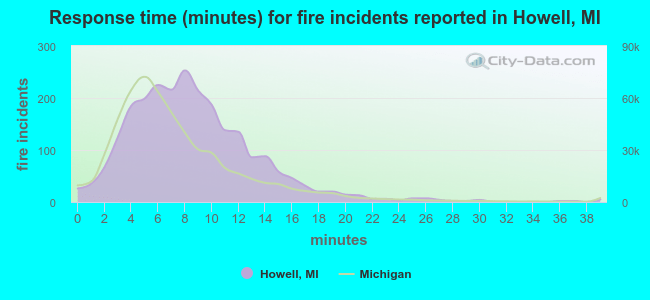 The median response time based on all reported fire incidents is 8 minutes. This is higher compared to the state median value.
The median response time in Howell, MI compared to nearest cities:
(Note: Based on data for all years, including only cities with at least 500 fire incidents)
| Howell: | 8 minutes |
| Fowlerville: | 11 minutes |
| Brighton: | 8 minutes |
| Pinckney: | 8 minutes |
| Whitmore Lake: | 8 minutes |
| Linden: | 10 minutes |
| Fenton: | 8 minutes |
| South Lyon: | 7 minutes |
| Dexter: | 8 minutes |
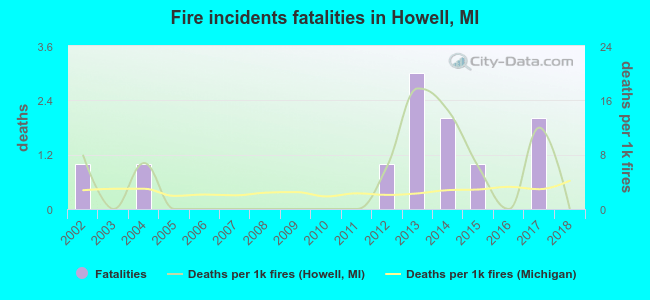 According to the data from the years 2002 - 2018 the average number of fire-related fatalities per year is 1. The highest number of reported deaths - 3 took place in 2013, and the lowest - 0 in 2003. The data has a dropping trend.
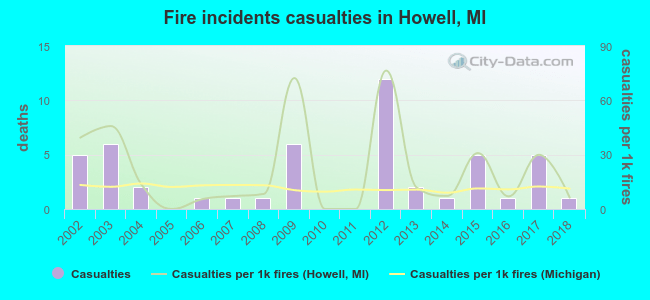 According to the reports from the years 2002 - 2018 the average number of fire-related yearly casualties is 3. The highest number of injuries - 12 took place in 2012, and the lowest - 0 in 2005. The data has a declining trend.
The average number of casualties per 1,000 fires is 21. This indicator was the highest - 76 in 2012, and the lowest 0 in 2005. The trend for injuries per 1,000 incidents is declining. Compared to the state value the number of casualties per 1,000 fire incidents is higher.
According to the reports from the years 2002 - 2018 the average number of fire-related yearly casualties is 3. The highest number of injuries - 12 took place in 2012, and the lowest - 0 in 2005. The data has a declining trend.
The average number of casualties per 1,000 fires is 21. This indicator was the highest - 76 in 2012, and the lowest 0 in 2005. The trend for injuries per 1,000 incidents is declining. Compared to the state value the number of casualties per 1,000 fire incidents is higher.Casualties per 1,000 incidents in Howell, MI compared to nearest cities:
(Note: Based on data for all years, including only cities with at least 500 fire incidents)
| Howell: | 20.2 |
| Fowlerville: | 3.7 |
| Brighton: | 7.3 |
| Pinckney: | 3.3 |
| Whitmore Lake: | 3.7 |
| Linden: | 1.2 |
| Fenton: | 2.8 |
| South Lyon: | 7.6 |
| Dexter: | 2.7 |
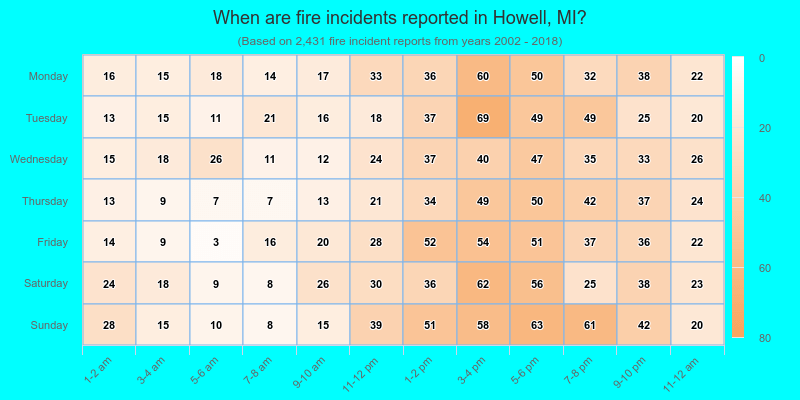
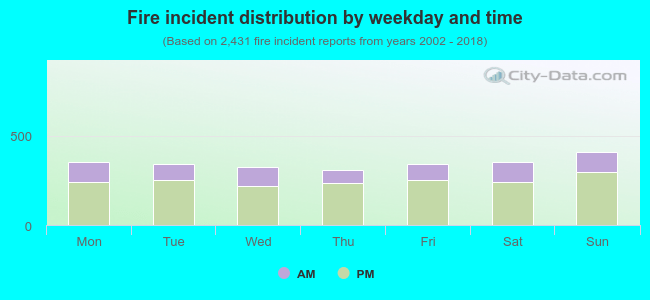 28.9% incidents where reported in the morning and 71.1% in the evening. The most fires (16.9%) took place on Sunday, and the least (12.6%) on Thursday.
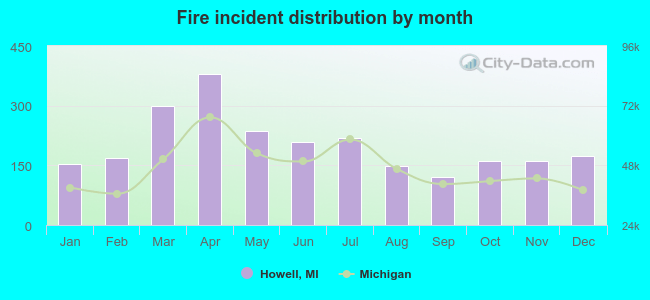 Based on the 2,431 incident reports from years 2002 - 2018 most fires (15.6%) took place during April, and the least (5.0%) in September.
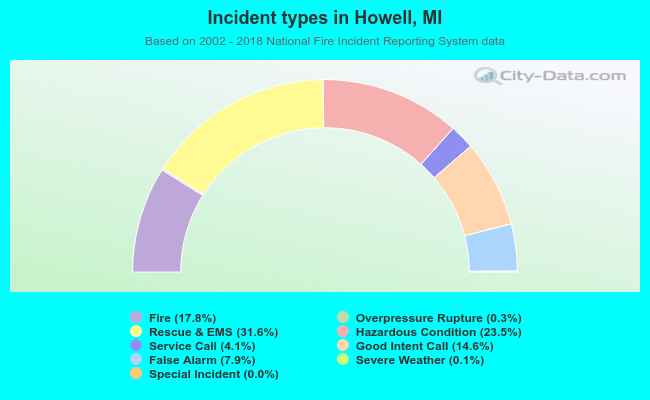 Out of all 13,622 cases reported during the years 2002 - 2018, the most belonged to the categories: Rescue & EMS (31.6%), Hazardous Condition (23.5%), and Fire (17.8%).
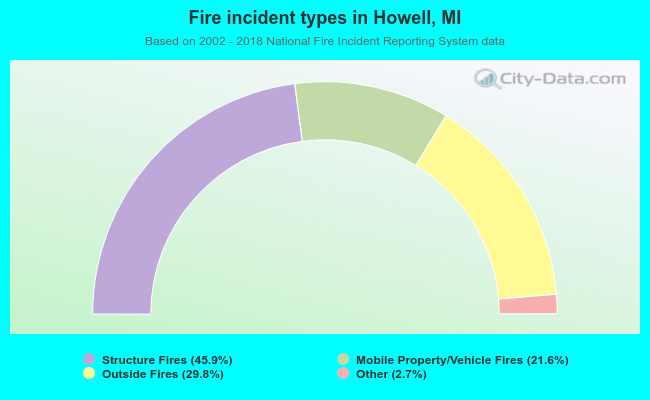 When looking into fire subcategories, the most incidents belonged to: Structure Fires (45.9%), and Outside Fires (29.8%).