Juneau: Fire Incidents, Alaska (AK)
Where are fire incidents reported in Juneau, AK
Something went wrong! Please refresh the page.
| Fire incidents reported | |
|---|---|
| Sreet name | Count |
| GLACIER HWY | 454 |
| DOUGLAS HWY | 142 |
| FRANKLIN ST | 124 |
| MENDENHALL LOOP RD | 116 |
| STEPHEN RICHARDS DR | 72 |
| EGAN DR | 60 |
| GLACIER AVE | 56 |
| RIVERSIDE DR | 54 |
| THANE RD | 50 |
| HARBOR WAY | 48 |
| WILLOUGHBY AVE | 48 |
| MENDENHALL MALL RD | 46 |
| GASTINEAU AVE | 34 |
| MARINE WAY | 32 |
| FRONT ST | 28 |
| CHURCHILL WAY | 26 |
| NORTHWOOD DR | 26 |
| LEMON CREEK RD | 24 |
| THUNDER MOUNTAIN RD | 24 |
| 3RD ST | 22 |
| 4TH ST | 22 |
| SAVIKKO RD | 22 |
| TRAFALGAR AVE | 22 |
| BIRCH LN | 20 |
| ENGINEERS CUTOFF RD | 20 |
| FRITZ COVE RD | 20 |
| LONG RUN DR | 20 |
| MENDENHALL LOOP | 20 |
| MENDENHALL PENINSULA RD | 20 |
| STEPHEN RICHARDS MEMORIAL DR | 20 |
| Other | 32 |
2002 - 2018 National Fire Incident Reporting System (NFIRS) incidents
- Incident types reported to NFIRS in Juneau, AK
- 17,43566.3%Rescue & EMS
- 2,76210.5%Good Intent Call
- 1,7246.6%Fire
- 1,5215.8%False Alarm
- 1,2954.9%Service Call
- 1,1334.3%Hazardous Condition
- 4111.6%Special Incident
- Fire incident types reported to NFIRS in Juneau, AK
- 89451.9%Structure Fires
- 47627.6%Outside Fires
- 32919.1%Mobile Property/Vehicle Fires
- 251.5%Other
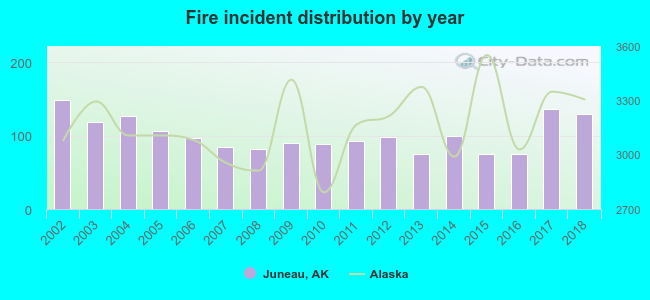 Based on the data from the years 2002 - 2018 the average number of fire incidents per year is 101. The highest number of reported fire incidents - 148 took place in 2002, and the least - 75 in 2013. The data has a dropping trend.
 The median response time based on all reported fire incidents is 8 minutes. This is similar to the state median value.
 Based on the reports from the years 2002 - 2018 the average number of fire-related casualties per year is 3. The highest number of reported injuries - 10 took place in 2008, and the lowest - 0 in 2002. The data has a growing trend.
The average number of injuries per 1,000 fires is 28. This indicator was the highest - 122 in 2008, and the lowest 0 in 2002. The trend for casualties per 1,000 fire incidents is rising. Compared to the state value the number of injuries per 1,000 incidents is higher.
Based on the reports from the years 2002 - 2018 the average number of fire-related casualties per year is 3. The highest number of reported injuries - 10 took place in 2008, and the lowest - 0 in 2002. The data has a growing trend.
The average number of injuries per 1,000 fires is 28. This indicator was the highest - 122 in 2008, and the lowest 0 in 2002. The trend for casualties per 1,000 fire incidents is rising. Compared to the state value the number of injuries per 1,000 incidents is higher.
 36.4% incidents where reported in the morning and 63.6% in the evening. The most fires (15.8%) took place on Sunday, and the least (12.6%) on Monday.
 According to the 1,724 fire incident reports from years 2002 - 2018 most fires (12.3%) took place during May, and the least (5.0%) in February.
 Out of all 26,290 cases reported during the years 2002 - 2018, the most belonged to the categories: Rescue & EMS (66.3%), Good Intent Call (10.5%), and Fire (6.6%).
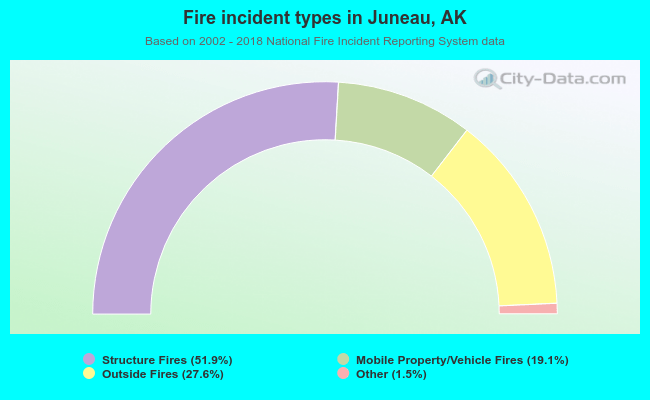 When looking into fire subcategories, the most incidents belonged to: Structure Fires (51.9%), and Outside Fires (27.6%).