Lake Dallas: Fire Incidents, Texas (TX)
Where are fire incidents reported in Lake Dallas, TX
Something went wrong! Please refresh the page.
|
| |||||||||||||||||||||||||||||||||||||||||||||||||||||||||||||||||||||||||||||||||||||||||||||||||||||||||||||
2002 - 2018 National Fire Incident Reporting System (NFIRS) incidents
- Incident types reported to NFIRS in Lake Dallas, TX
- 2,65154.8%Rescue & EMS
- 59612.3%Good Intent Call
- 54011.2%Service Call
- 4238.7%Hazardous Condition
- 4138.5%Fire
- 1984.1%False Alarm
- 90.2%Overpressure Rupture
- 90.2%Special Incident
- Fire incident types reported to NFIRS in Lake Dallas, TX
- 23356.4%Structure Fires
- 11227.1%Outside Fires
- 5212.6%Mobile Property/Vehicle Fires
- 163.9%Other
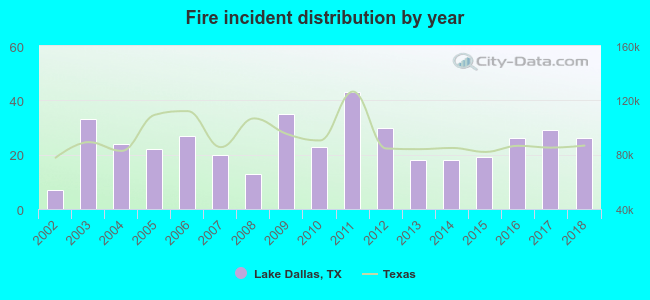 Based on the data from the years 2002 - 2018 the average number of fires per year is 24. The highest number of reported fire incidents - 43 took place in 2011, and the least - 7 in 2002. The data has an increasing trend.
The average number of yearly fire incidents per 10k residents in Lake Dallas, TX compared to nearest cities:
(Note: Based on data for the last 3 years, including only cities with population 5,000 and above)
| Lake Dallas: | 36.3 |
| Corinth: | 16.5 |
| Highland Village: | 24.0 |
| Little Elm: | 33.7 |
| Lewisville: | 27.2 |
| Flower Mound: | 16.0 |
| Colony: | 0.2 |
| Denton: | 24.7 |
| The Colony: | 16.8 |
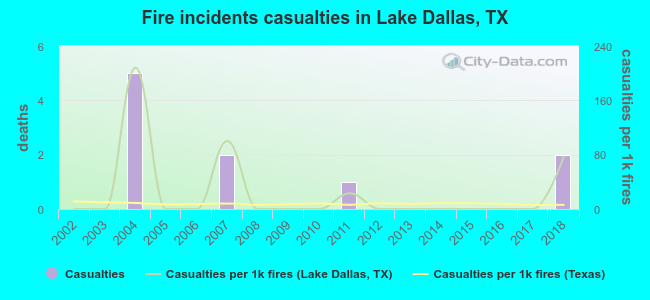 Based on the reports from the years 2002 - 2018 the average number of fire-related casualties per year is 1. The highest number of reported injuries - 5 took place in 2004, and the lowest - 0 in 2002. The data has a growing trend.
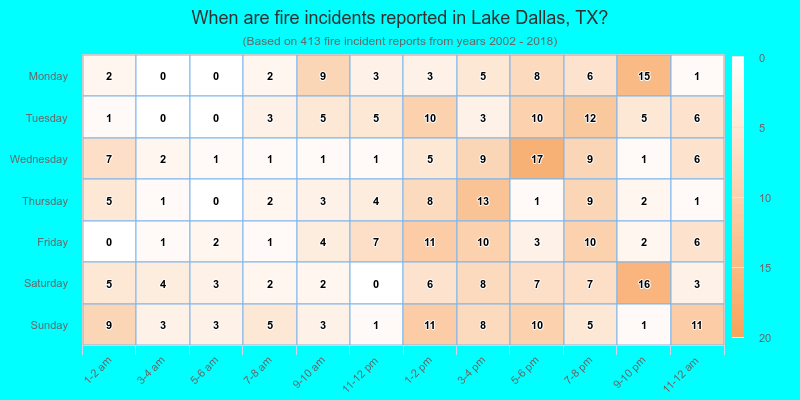
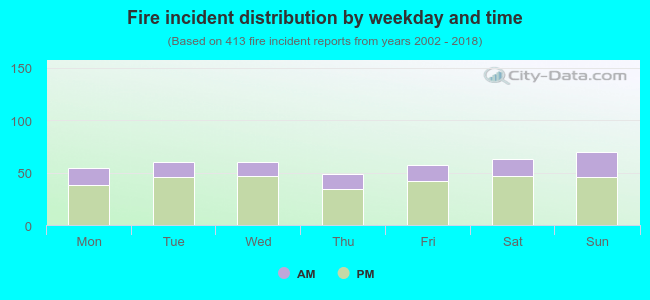 27.4% incidents where reported in the morning and 72.6% in the evening. The most fires (16.9%) took place on Sunday, and the least (11.9%) on Thursday.
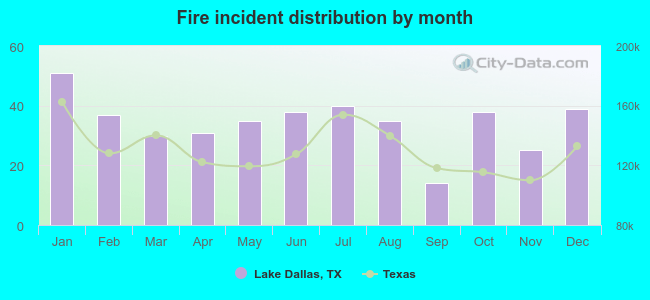 According to the 413 incident reports from years 2002 - 2018 most fires (12.3%) took place during January, and the least (3.4%) in September.
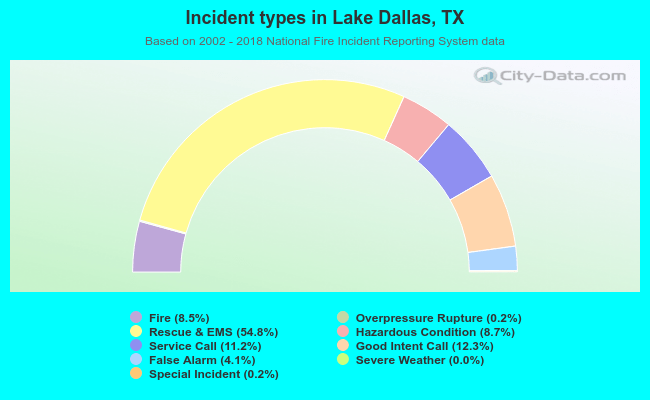 Out of all 4,840 cases reported during the years 2002 - 2018, the most belonged to the categories: Rescue & EMS (54.8%), Good Intent Call (12.3%), and Service Call (11.2%).
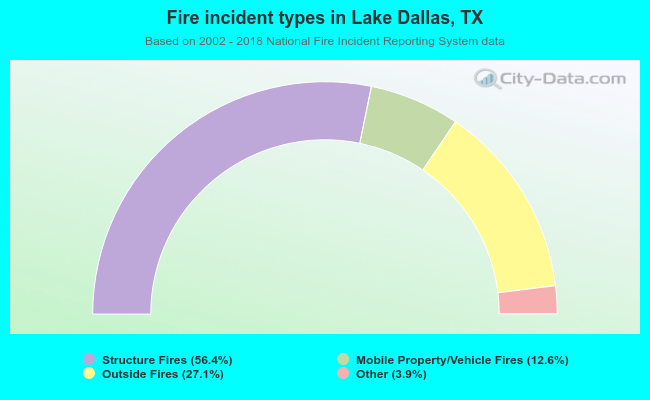 When looking into fire subcategories, the most reports belonged to: Structure Fires (56.4%), and Outside Fires (27.1%).