Las Vegas: Fire Incidents, New Mexico (NM)
Where are fire incidents reported in Las Vegas, NM
Something went wrong! Please refresh the page.
| Fire incidents reported | |
|---|---|
| Sreet name | Count |
| 7TH ST | 48 |
| GRAND AVE | 42 |
| RAILROAD AVE | 30 |
| I25 | 28 |
| PECOS ST | 26 |
| HWY 104 | 24 |
| MILLS AVE | 24 |
| 8TH ST | 20 |
| I25 HWY | 20 |
| NEW MEXICO AVE | 20 |
| PECOS | 20 |
| UNION | 20 |
| HOT SPRINGS BLVD | 18 |
| HWY 283 | 18 |
| ROMERO ST | 18 |
| SOUTH PACIFIC | 18 |
| 7TH STREET | 16 |
| AIRPORT RD | 16 |
| COMMERCE | 16 |
| GRAND AVE | 16 |
| TAOS ST | 14 |
| 6TH ST | 12 |
| 7TH | 12 |
| CALLE CONTENTA | 12 |
| CHAVEZ | 12 |
| CINDER RD | 12 |
| EL LLANO RD | 12 |
| GRAND | 12 |
| HOT SPRINGS | 12 |
| LUNA DR | 12 |
| Other | 828 |
2003 - 2018 National Fire Incident Reporting System (NFIRS) incidents
- Incident types reported to NFIRS in Las Vegas, NM
- 1,40835.1%Fire
- 96824.1%Hazardous Condition
- 47911.9%Rescue & EMS
- 47511.8%False Alarm
- 3238.1%Service Call
- 3107.7%Good Intent Call
- 210.5%Special Incident
- 170.4%Overpressure Rupture
- 80.2%Severe Weather
- Fire incident types reported to NFIRS in Las Vegas, NM
- 76154.0%Outside Fires
- 34324.4%Structure Fires
- 15511.0%Other
- 14910.6%Mobile Property/Vehicle Fires
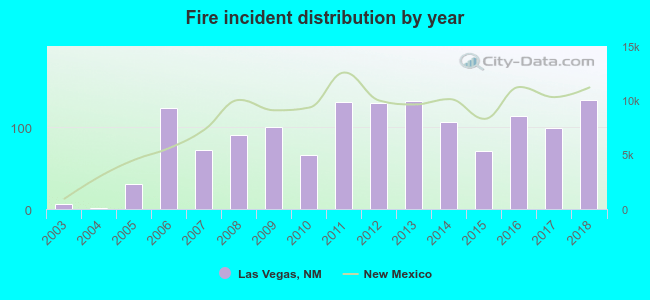 According to the data from the years 2003 - 2018 the average number of fire incidents per year is 88. The highest number of fires - 133 took place in 2018, and the least - 1 in 2004. The data has an increasing trend.
The average number of yearly fire incidents per 10k residents in Las Vegas, NM compared to nearest cities:
(Note: Based on data for the last 3 years, including only cities with population 5,000 and above)
| Las Vegas: | 85.3 |
| Eldorado at Santa Fe: | 21.2 |
| Santa Fe: | 24.3 |
| Espanola: | 84.6 |
| San Juan Pueblo: | 1.5 |
| White Rock: | 7.6 |
 The median response time based on all reported fire incidents is 5 minutes. This is lower compared to the state median value.
The median response time in Las Vegas, NM compared to nearest cities:
(Note: Based on data for all years, including only cities with at least 500 fire incidents)
| Las Vegas: | 5 minutes |
| Santa Fe: | 7 minutes |
| Chimayo: | 18 minutes |
| La Cienega: | 15 minutes |
| Espanola: | 5 minutes |
 Based on the data from the years 2003 - 2018 the average number of fire-related yearly deaths is 0. The highest number of reported deaths - 1 took place in 2008, and the lowest - 0 in 2003. The data has a constant trend.
 30.4% incidents where reported in the morning and 69.6% in the evening. The most fires (15.9%) took place on Sunday, and the least (13.4%) on Tuesday.
 According to the 1,408 fire incident reports from years 2003 - 2018 most fires (11.6%) took place during March, and the least (5.3%) in September.
 Out of all 4,009 cases reported during the years 2003 - 2018, the most belonged to the categories: Fire (35.1%), Hazardous Condition (24.1%), and Rescue & EMS (11.9%).
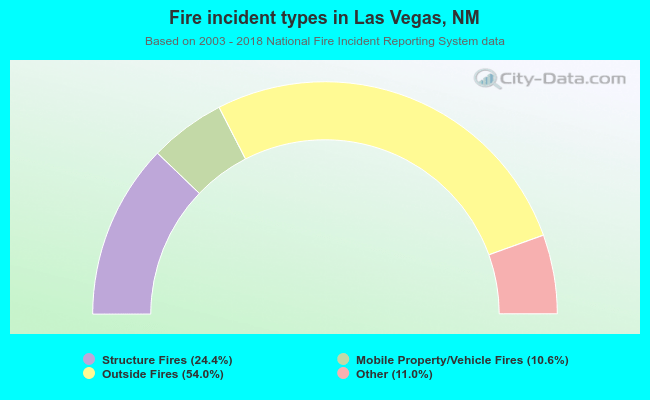 When looking into fire subcategories, the most reports belonged to: Outside Fires (54.0%), and Structure Fires (24.4%).