Leon Valley: Fire Incidents, Texas (TX)
Where are fire incidents reported in Leon Valley, TX
Something went wrong! Please refresh the page.
|
| |||||||||||||||||||||||||||||||||||||||||||||||||||||||||||||||||||||||||||||||||||||||||||||||||||||||||||||
2005 - 2018 National Fire Incident Reporting System (NFIRS) incidents
- Incident types reported to NFIRS in Leon Valley, TX
- 7,41779.3%Rescue & EMS
- 6246.7%Good Intent Call
- 4675.0%False Alarm
- 4174.5%Service Call
- 2092.2%Fire
- 1751.9%Hazardous Condition
- 260.3%Special Incident
- Fire incident types reported to NFIRS in Leon Valley, TX
- 8842.1%Structure Fires
- 5928.2%Outside Fires
- 5224.9%Mobile Property/Vehicle Fires
- 104.8%Other
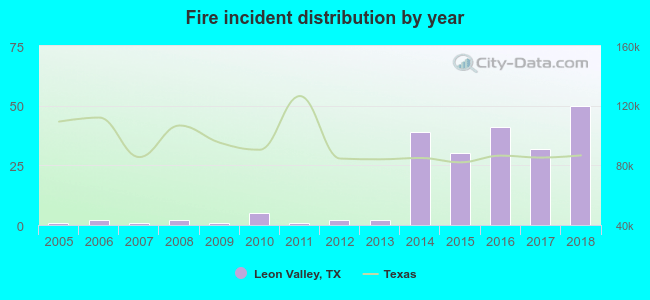 According to the data from the years 2005 - 2018 the average number of fire incidents per year is 15. The highest number of reported fire incidents - 50 took place in 2018, and the least - 1 in 2005. The data has a growing trend.
The average number of yearly fire incidents per 10k residents in Leon Valley, TX compared to nearest cities:
(Note: Based on data for the last 3 years, including only cities with population 5,000 and above)
| Leon Valley: | 37.2 |
| Helotes: | 33.9 |
| San Antonio: | 25.7 |
| Alamo Heights: | 27.3 |
| Terrell Hills: | 7.7 |
| Kirby: | 30.8 |
| Windcrest: | 17.5 |
| Fair Oaks Ranch: | 18.3 |
| Live Oak: | 4.0 |
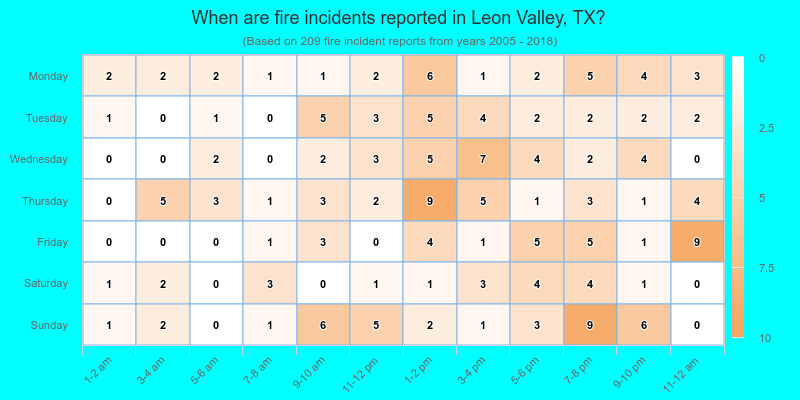
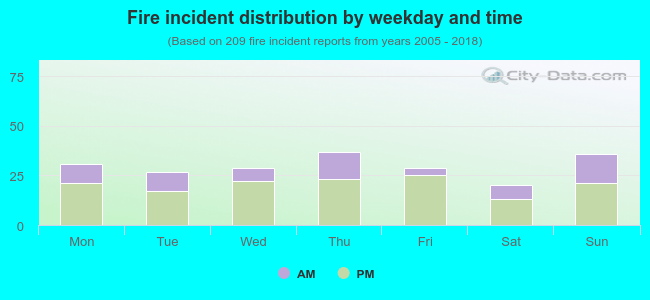 32.1% incidents where reported in the morning and 67.9% in the evening. The most fires (17.7%) took place on Thursday, and the least (9.6%) on Saturday.
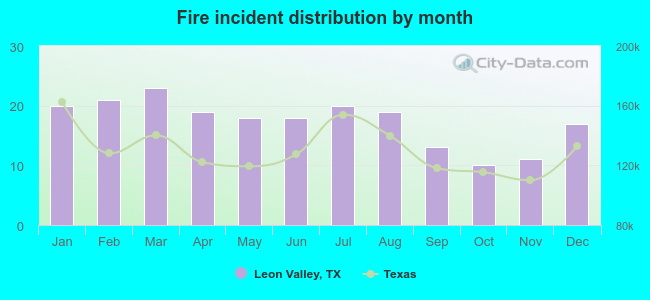 According to the 209 incident reports from years 2005 - 2018 most fires (11.0%) took place during March, and the least (4.8%) in October.
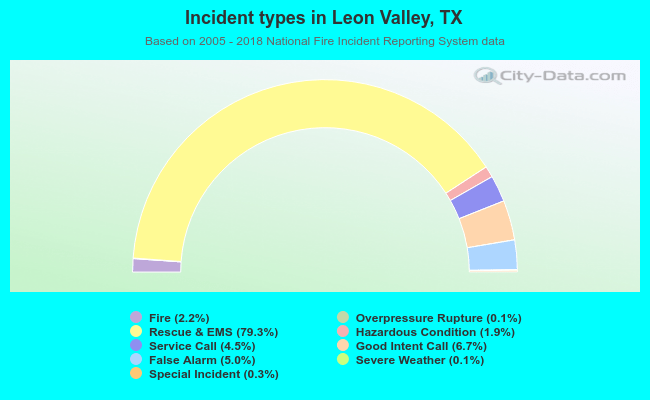 Out of all 9,348 cases reported during the years 2005 - 2018, the most belonged to the categories: Rescue & EMS (79.3%), Good Intent Call (6.7%), and False Alarm (5.0%).
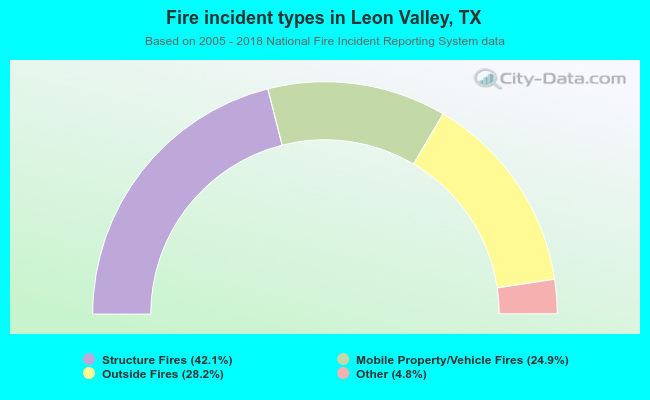 When looking into fire subcategories, the most incidents belonged to: Structure Fires (42.1%), and Outside Fires (28.2%).