Los Fresnos: Fire Incidents, Texas (TX)
Where are fire incidents reported in Los Fresnos, TX
Something went wrong! Please refresh the page.
|
| |||||||||||||||||||||||||||||||||||||||||||||||||||||||||||||||||||||||||||||||||||||||||||||||||||||||||||||
| Other | 355 | |||||||||||||||||||||||||||||||||||||||||||||||||||||||||||||||||||||||||||||||||||||||||||||||||||||||||||||
2002 - 2018 National Fire Incident Reporting System (NFIRS) incidents
- Incident types reported to NFIRS in Los Fresnos, TX
- 1,06753.8%Fire
- 44622.5%Rescue & EMS
- 23211.7%Hazardous Condition
- 854.3%False Alarm
- 783.9%Service Call
- 683.4%Good Intent Call
- 60.3%Overpressure Rupture
- Fire incident types reported to NFIRS in Los Fresnos, TX
- 78373.4%Outside Fires
- 12211.4%Structure Fires
- 847.9%Other
- 787.3%Mobile Property/Vehicle Fires
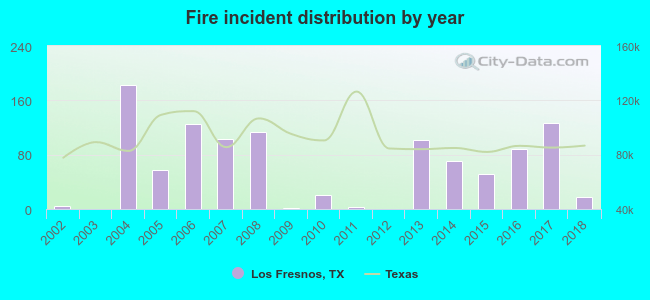 According to the data from the years 2002 - 2018 the average number of fire incidents per year is 63. The highest number of reported fires - 182 took place in 2004, and the least - 0 in 2003. The data has a rising trend.
The average number of yearly fire incidents per 10k residents in Los Fresnos, TX compared to nearest cities:
(Note: Based on data for the last 3 years, including only cities with population 5,000 and above)
| Los Fresnos: | 120.5 |
| Cameron Park: | 2.9 |
| Brownsville: | 21.8 |
| Lantana: | 3.4 |
| San Benito: | 68.7 |
| Harlingen: | 48.9 |
| Port Isabel: | 5.3 |
| La Feria: | 14.1 |
| Mercedes: | 51.4 |
 The median response time based on all reported fire incidents is 8 minutes. This is higher than the state median value.
The median response time in Los Fresnos, TX compared to nearest cities:
(Note: Based on data for all years, including only cities with at least 500 fire incidents)
| Los Fresnos: | 8 minutes |
| Brownsville: | 8 minutes |
| San Benito: | 5 minutes |
| Harlingen: | 7 minutes |
| Mercedes: | 9 minutes |
| Weslaco: | 7 minutes |
 25.8% incidents where reported in the morning and 74.2% in the evening. The most fires (15.7%) took place on Sunday, and the least (12.3%) on Tuesday.
 According to the 1,067 fires from years 2002 - 2018 most fires (13.6%) took place during January, and the least (4.9%) in October.
 Out of all 1,982 cases reported during the years 2002 - 2018, the most belonged to the categories: Fire (53.8%), Rescue & EMS (22.5%), and Hazardous Condition (11.7%).
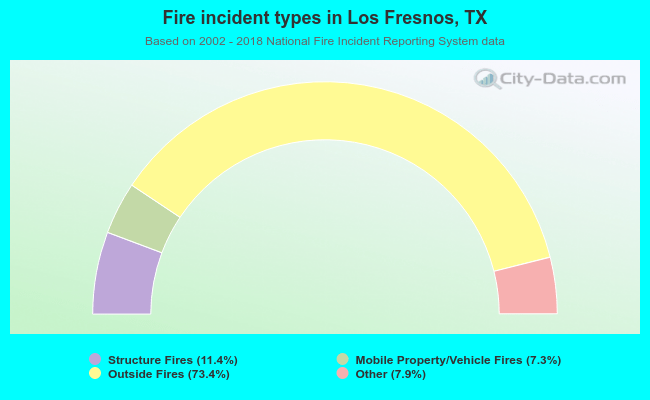 When looking into fire subcategories, the most incidents belonged to: Outside Fires (73.4%), and Structure Fires (11.4%).