Lumberton: Fire Incidents, Texas (TX)
Where are fire incidents reported in Lumberton, TX
Something went wrong! Please refresh the page.
|
| |||||||||||||||||||||||||||||||||||||||||||||||||||||||||||||||||||||||||||||||||||||||||||||||||||||||||||||
| Other | 23 | |||||||||||||||||||||||||||||||||||||||||||||||||||||||||||||||||||||||||||||||||||||||||||||||||||||||||||||
2002 - 2018 National Fire Incident Reporting System (NFIRS) incidents
- Incident types reported to NFIRS in Lumberton, TX
- 1,30337.5%Fire
- 1,04029.9%Hazardous Condition
- 70920.4%Rescue & EMS
- 1855.3%Good Intent Call
- 1113.2%Service Call
- 1073.1%False Alarm
- 110.3%Special Incident
- 60.2%Severe Weather
- Fire incident types reported to NFIRS in Lumberton, TX
- 76058.3%Outside Fires
- 33825.9%Structure Fires
- 16112.4%Mobile Property/Vehicle Fires
- 443.4%Other
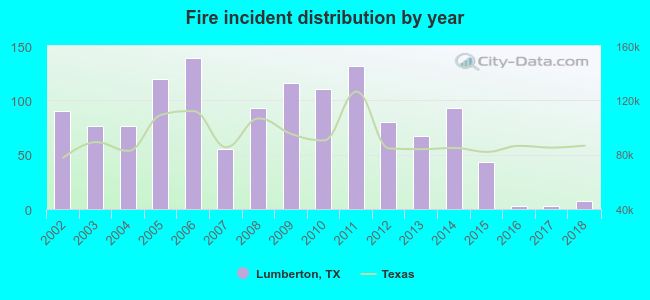 Based on the data from the years 2002 - 2018 the average number of fire incidents per year is 77. The highest number of fire incidents - 139 took place in 2006, and the least - 3 in 2016. The data has a dropping trend.
The average number of yearly fire incidents per 10k residents in Lumberton, TX compared to nearest cities:
(Note: Based on data for the last 3 years, including only cities with population 5,000 and above)
| Lumberton: | 3.5 |
| Silsbee: | 174.8 |
| Beaumont: | 45.4 |
| Vidor: | 261.3 |
| Nederland: | 62.2 |
| Port Neches: | 43.6 |
| Bridge City: | 86.7 |
| Groves: | 63.1 |
| Orange: | 82.5 |
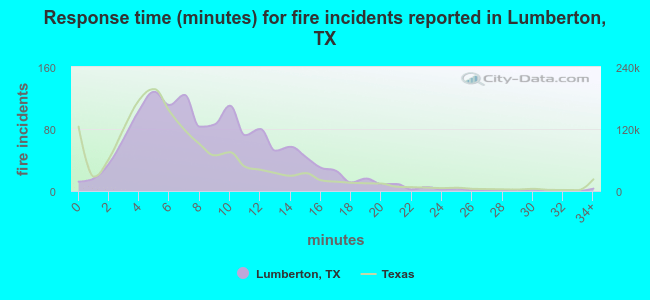 The median response time based on all reported fire incidents is 8 minutes. This is higher compared to the state median value.
The median response time in Lumberton, TX compared to nearest cities:
(Note: Based on data for all years, including only cities with at least 500 fire incidents)
| Lumberton: | 8 minutes |
| Silsbee: | 5 minutes |
| Kountze: | 7 minutes |
| Beaumont: | 4 minutes |
| Vidor: | 7 minutes |
| Nederland: | 5 minutes |
| Port Neches: | 5 minutes |
| Bridge City: | 8 minutes |
| Groves: | 4 minutes |
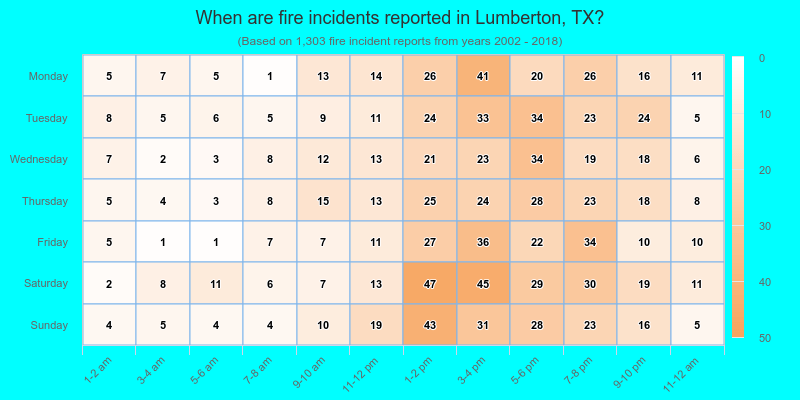
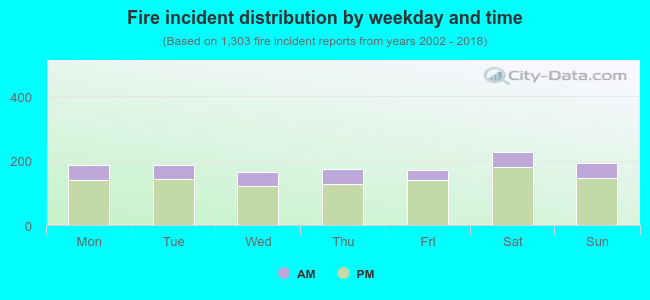 23.6% incidents where reported in the morning and 76.4% in the evening. The most fires (17.5%) took place on Saturday, and the least (12.7%) on Wednesday.
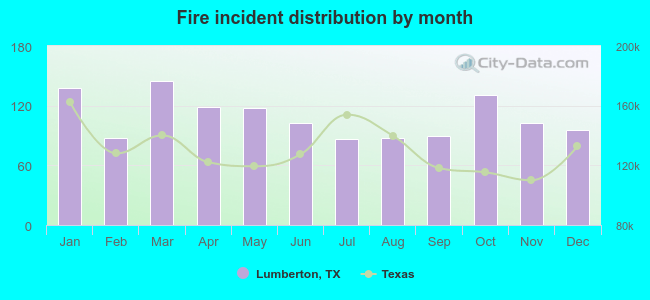 Based on the 1,303 reports from years 2002 - 2018 most fires (11.1%) took place during March, and the least (6.6%) in July.
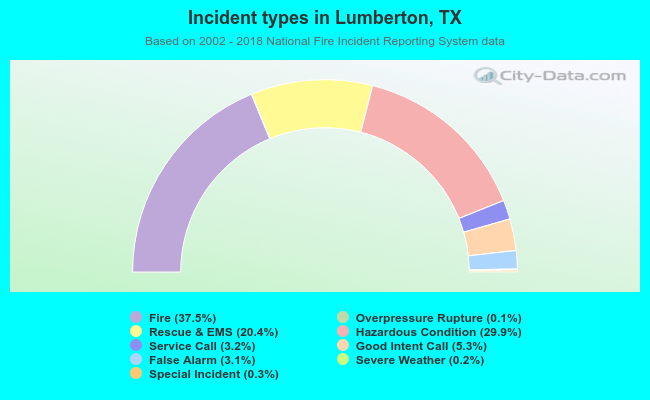 Out of all 3,474 cases reported during the years 2002 - 2018, the most belonged to the categories: Fire (37.5%), Hazardous Condition (29.9%), and Rescue & EMS (20.4%).
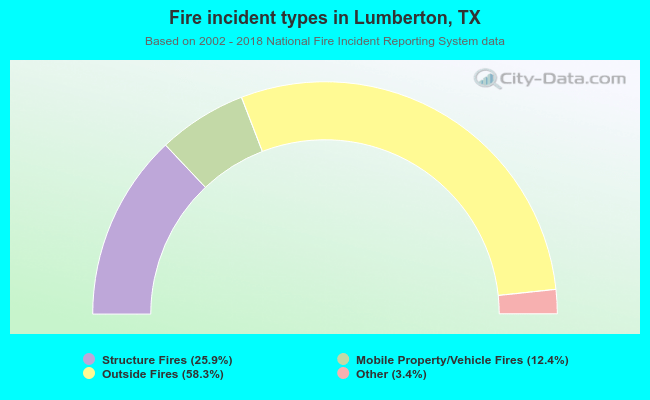 When looking into fire subcategories, the most reports belonged to: Outside Fires (58.3%), and Structure Fires (25.9%).