Lynnwood: Fire Incidents, Washington (WA)
Where are fire incidents reported in Lynnwood, WA
Something went wrong! Please refresh the page.
| Fire incidents reported | |
|---|---|
| Sreet name | Count |
| 164 ST | 398 |
| 196 ST | 254 |
| HWY 99 | 240 |
| 99 HWY | 186 |
| 44 AVE | 176 |
| LARCH WAY | 142 |
| 35 AVE | 136 |
| ASH WAY | 130 |
| 148 ST | 118 |
| ADMIRALTY WAY | 112 |
| 200 ST | 110 |
| 156 ST | 104 |
| 40 AVE | 100 |
| 48 AVE | 96 |
| 184 ST | 92 |
| 52 AVE | 88 |
| 36 AVE | 82 |
| 168 ST | 80 |
| 204 ST | 78 |
| 208 ST | 74 |
| 164TH ST | 72 |
| 202 ST | 68 |
| 68 AVE | 66 |
| LINCOLN WAY | 62 |
| 176 ST | 60 |
| ALDERWOOD MALL PKY | 60 |
| 196TH ST | 56 |
| 6 AVE | 56 |
| NORTH RD | 54 |
| MANOR WAY | 52 |
| Other | 329 |
2002 - 2018 National Fire Incident Reporting System (NFIRS) incidents
- Incident types reported to NFIRS in Lynnwood, WA
- 36,53965.5%Rescue & EMS
- 6,97312.5%Good Intent Call
- 3,7316.7%Fire
- 3,4096.1%Service Call
- 2,6134.7%False Alarm
- 2,3804.3%Hazardous Condition
- 690.1%Special Incident
- Fire incident types reported to NFIRS in Lynnwood, WA
- 1,49540.1%Structure Fires
- 1,47439.5%Outside Fires
- 58515.7%Mobile Property/Vehicle Fires
- 1774.7%Other
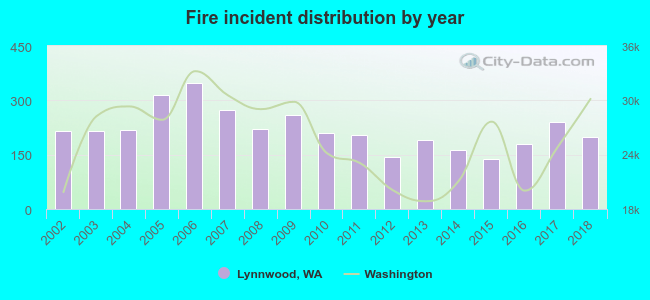 According to the data from the years 2002 - 2018 the average number of fire incidents per year is 219. The highest number of reported fires - 347 took place in 2006, and the least - 138 in 2015. The data has a declining trend.
The average number of yearly fire incidents per 10k residents in Lynnwood, WA compared to nearest cities:
(Note: Based on data for the last 3 years, including only cities with population 5,000 and above)
| Lynnwood: | 56.1 |
| Mountlake Terrace: | 14.9 |
| Edmonds: | 16.5 |
| Brier: | 10.4 |
| Lake Forest Park: | 12.6 |
| Shoreline: | 23.4 |
| Mill Creek: | 10.8 |
| Kenmore: | 14.5 |
| Bothell: | 32.5 |
 The median response time based on all reported fire incidents is 7 minutes. This is close to the state median value.
The median response time in Lynnwood, WA compared to nearest cities:
(Note: Based on data for all years, including only cities with at least 500 fire incidents)
| Lynnwood: | 7 minutes |
| Mountlake Terrace: | 7 minutes |
| Edmonds: | 7 minutes |
| Shoreline: | 7 minutes |
| Kenmore: | 6 minutes |
| Bothell: | 6 minutes |
| Mukilteo: | 6 minutes |
| Woodinville: | 7 minutes |
| Everett: | 6 minutes |
 According to the data from the years 2002 - 2018 the average number of fire-related casualties per year is 2. The highest number of injuries - 7 took place in 2008, and the lowest - 0 in 2002. The data has a constant trend.
The average number of casualties per 1,000 fires is 8. This indicator was the highest - 32 in 2008, and the lowest 0 in 2002. The trend for injuries per 1,000 incidents is constant. Compared to the state value the number of casualties per 1,000 fire incidents is similar.
According to the data from the years 2002 - 2018 the average number of fire-related casualties per year is 2. The highest number of injuries - 7 took place in 2008, and the lowest - 0 in 2002. The data has a constant trend.
The average number of casualties per 1,000 fires is 8. This indicator was the highest - 32 in 2008, and the lowest 0 in 2002. The trend for injuries per 1,000 incidents is constant. Compared to the state value the number of casualties per 1,000 fire incidents is similar.Casualties per 1,000 incidents in Lynnwood, WA compared to nearest cities:
(Note: Based on data for all years, including only cities with at least 500 fire incidents)
| Lynnwood: | 7.8 |
| Mountlake Terrace: | 13.9 |
| Edmonds: | 13.1 |
| Shoreline: | 19.2 |
| Kenmore: | 7.4 |
| Bothell: | 10.0 |
| Mukilteo: | 19.2 |
| Woodinville: | 3.3 |
| Everett: | 15.0 |
 33.9% incidents where reported in the morning and 66.1% in the evening. The most fires (15.6%) took place on Saturday, and the least (13.6%) on Thursday.
 Based on the 3,731 incident reports from years 2002 - 2018 most fires (19.1%) took place during July, and the least (5.5%) in February.
 Out of all 55,775 cases reported during the years 2002 - 2018, the most belonged to the categories: Rescue & EMS (65.5%), Good Intent Call (12.5%), and Fire (6.7%).
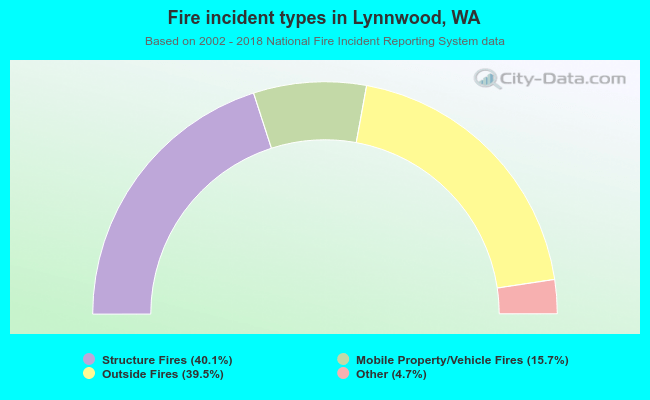 When looking into fire subcategories, the most incidents belonged to: Structure Fires (40.1%), and Outside Fires (39.5%).