Mansfield: Fire Incidents, Texas (TX)
Where are fire incidents reported in Mansfield, TX
Something went wrong! Please refresh the page.
| Fire incidents reported | |
|---|---|
| Sreet name | Count |
| BROAD ST | 248 |
| US 287 | 226 |
| MAIN ST | 190 |
| WALNUT CREEK DR | 170 |
| 287 HWY | 116 |
| LONE STAR RD | 110 |
| MATLOCK RD | 108 |
| US 287 HWY | 88 |
| FM 157 | 74 |
| NEWT PATTERSON RD | 74 |
| TOWNE CROSSING BLVD | 72 |
| DEBBIE LN | 70 |
| SH 360 | 70 |
| HERITAGE PKY | 66 |
| HOLLAND RD | 66 |
| COUNTRY CLUB DR | 62 |
| SH 360 HWY | 50 |
| DALLAS ST | 48 |
| KINGS WAY DR | 48 |
| GERTIE BARRETT RD | 46 |
| FM 917 | 42 |
| MITCHELL RD | 42 |
| SEETON RD | 40 |
| 157 HWY | 38 |
| 360 HWY | 34 |
| SECOND AVE | 34 |
| MAGNOLIA ST | 30 |
| WISTERIA ST | 30 |
| BRITTON RD | 28 |
| CARDINAL RD | 28 |
| Other | 557 |
2002 - 2018 National Fire Incident Reporting System (NFIRS) incidents
- Incident types reported to NFIRS in Mansfield, TX
- 15,11650.5%Rescue & EMS
- 4,76115.9%Hazardous Condition
- 2,9059.7%Fire
- 2,7039.0%Good Intent Call
- 2,2517.5%False Alarm
- 1,9526.5%Service Call
- 1120.4%Overpressure Rupture
- 760.3%Special Incident
- 340.1%Severe Weather
- Fire incident types reported to NFIRS in Mansfield, TX
- 1,37347.3%Outside Fires
- 86429.7%Structure Fires
- 46215.9%Mobile Property/Vehicle Fires
- 2067.1%Other
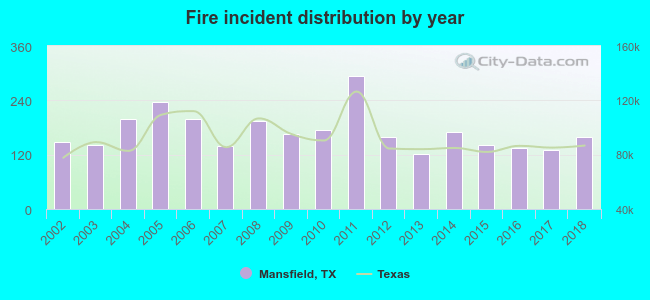 According to the data from the years 2002 - 2018 the average number of fire incidents per year is 171. The highest number of reported fires - 294 took place in 2011, and the least - 121 in 2013. The data has an increasing trend.
The average number of yearly fire incidents per 10k residents in Mansfield, TX compared to nearest cities:
(Note: Based on data for the last 3 years, including only cities with population 5,000 and above)
| Mansfield: | 22.7 |
| Rendon: | 22.8 |
| Kennedale: | 64.9 |
| Arlington: | 23.6 |
| Everman: | 45.4 |
| Forest Hill: | 53.9 |
| Midlothian: | 68.0 |
| Cedar Hill: | 34.2 |
| Grand Prairie: | 27.7 |
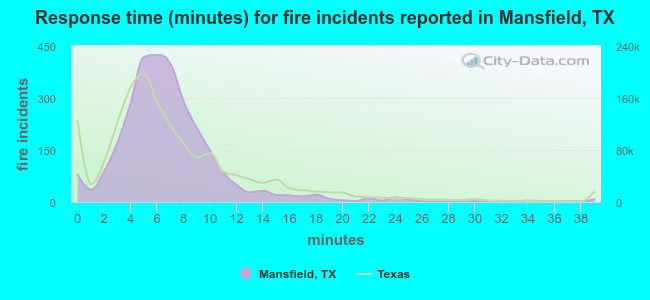 The median response time based on all reported fire incidents is 6 minutes. This is close to the Texas median value.
The median response time in Mansfield, TX compared to nearest cities:
(Note: Based on data for all years, including only cities with at least 500 fire incidents)
| Mansfield: | 6 minutes |
| Rendon: | 12 minutes |
| Kennedale: | 4 minutes |
| Arlington: | 5 minutes |
| Everman: | 6 minutes |
| Forest Hill: | 5 minutes |
| Venus: | 13 minutes |
| Midlothian: | 8 minutes |
| Cedar Hill: | 6 minutes |
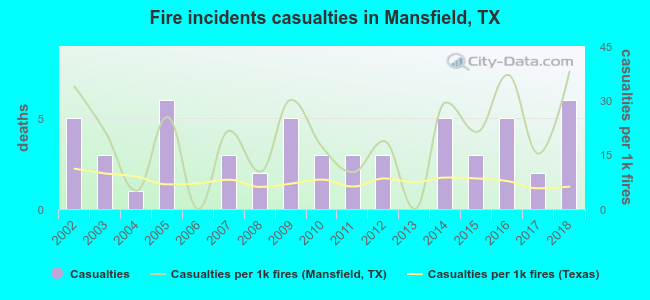 According to the reports from the years 2002 - 2018 the average number of fire-related casualties per year is 3. The highest number of reported casualties - 6 took place in 2005, and the lowest - 0 in 2006. The data has a rising trend.
The average number of injuries per 1,000 fires is 20. This indicator was the highest - 38 in 2018, and the lowest 0 in 2006. The trend for injuries per 1,000 fires is increasing. Compared to the state value the number of injuries per 1,000 incidents is much higher.
According to the reports from the years 2002 - 2018 the average number of fire-related casualties per year is 3. The highest number of reported casualties - 6 took place in 2005, and the lowest - 0 in 2006. The data has a rising trend.
The average number of injuries per 1,000 fires is 20. This indicator was the highest - 38 in 2018, and the lowest 0 in 2006. The trend for injuries per 1,000 fires is increasing. Compared to the state value the number of injuries per 1,000 incidents is much higher.Casualties per 1,000 incidents in Mansfield, TX compared to nearest cities:
(Note: Based on data for all years, including only cities with at least 500 fire incidents)
| Mansfield: | 18.9 |
| Rendon: | 0.0 |
| Kennedale: | 12.2 |
| Arlington: | 26.2 |
| Everman: | 0.0 |
| Forest Hill: | 9.5 |
| Venus: | 3.2 |
| Midlothian: | 12.3 |
| Cedar Hill: | 13.7 |
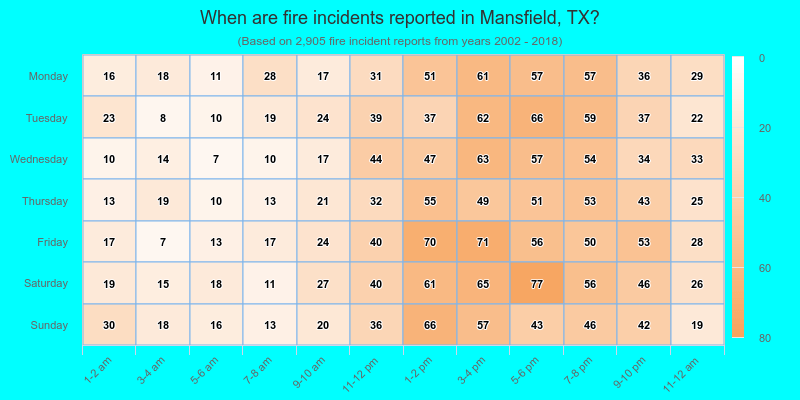
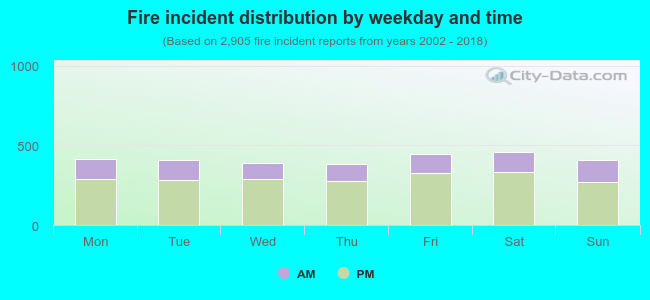 28.7% incidents where reported in the morning and 71.3% in the evening. The most fires (15.9%) took place on Saturday, and the least (13.2%) on Thursday.
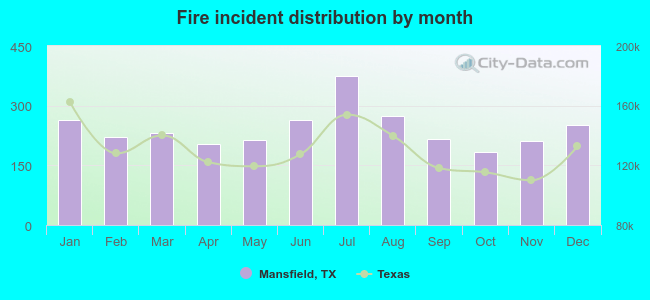 According to the 2,905 fires from years 2002 - 2018 most fires (12.9%) took place during July, and the least (6.3%) in October.
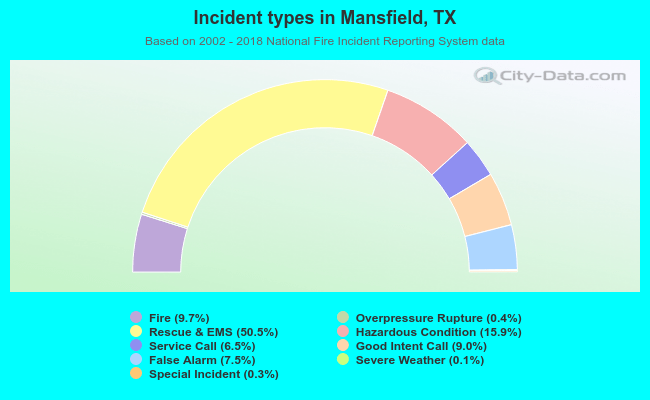 Out of all 29,910 cases reported during the years 2002 - 2018, the most belonged to the categories: Rescue & EMS (50.5%), Hazardous Condition (15.9%), and Fire (9.7%).
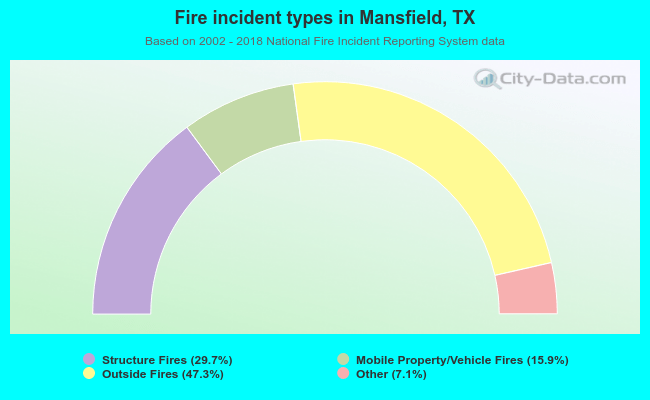 When looking into fire subcategories, the most reports belonged to: Outside Fires (47.3%), and Structure Fires (29.7%).