McKinney: Fire Incidents, Texas (TX)
Where are fire incidents reported in McKinney, TX
Something went wrong! Please refresh the page.
| Fire incidents reported | |
|---|---|
| Sreet name | Count |
| CENTRAL EXPY | 376 |
| UNIVERSITY DR | 330 |
| MCDONALD ST | 240 |
| ELDORADO PKY | 154 |
| WILSON CREEK BLVD | 130 |
| CUSTER RD | 126 |
| ELDORADO PKWY | 126 |
| 75 | 110 |
| MEDICAL CENTER DR | 98 |
| CR 1006 | 94 |
| SKYLINE DR | 86 |
| TENNESSEE ST | 86 |
| LAKE FOREST DR | 84 |
| CHURCH ST | 80 |
| LOUISIANA ST | 80 |
| REDBUD BLVD | 68 |
| NORTH BROOK DR | 66 |
| WHITE AVE | 60 |
| BUMPAS ST | 54 |
| ELDORADO | 52 |
| INDUSTRIAL BLVD | 52 |
| STONEBRIDGE DR | 52 |
| COMMUNITY AVE | 50 |
| GRAVES ST | 48 |
| FM 546 | 44 |
| HARDIN BLVD | 44 |
| KENTUCKY ST | 44 |
| VIRGINIA PKWY | 40 |
| MCKINNEY RANCH PKWY | 38 |
| RIDGE RD | 38 |
| Other | 993 |
2003 - 2018 National Fire Incident Reporting System (NFIRS) incidents
- Incident types reported to NFIRS in McKinney, TX
- 40,30664.0%Rescue & EMS
- 5,6909.0%False Alarm
- 5,2008.3%Hazardous Condition
- 4,8047.6%Service Call
- 3,9436.3%Fire
- 2,8144.5%Good Intent Call
- 830.1%Overpressure Rupture
- 790.1%Special Incident
- Fire incident types reported to NFIRS in McKinney, TX
- 1,99750.6%Outside Fires
- 97224.7%Structure Fires
- 66716.9%Mobile Property/Vehicle Fires
- 3077.8%Other
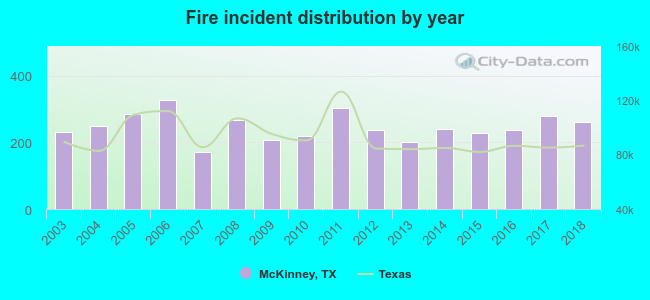 Based on the data from the years 2003 - 2018 the average number of fire incidents per year is 246. The highest number of fire incidents - 326 took place in 2006, and the least - 172 in 2007. The data has an increasing trend.
The average number of yearly fire incidents per 10k residents in McKinney, TX compared to nearest cities:
(Note: Based on data for the last 3 years, including only cities with population 5,000 and above)
| McKinney: | 16.5 |
| Fairview: | 41.5 |
| Allen: | 14.0 |
| Melissa: | 104.9 |
| Lucas: | 54.9 |
| Princeton: | 102.0 |
| Prosper: | 41.9 |
| Frisco: | 17.9 |
| Anna: | 104.4 |
 The median response time based on all reported fire incidents is 6 minutes. This is comparable to the Texas median value.
The median response time in McKinney, TX compared to nearest cities:
(Note: Based on data for all years, including only cities with at least 500 fire incidents)
| McKinney: | 6 minutes |
| Allen: | 6 minutes |
| Melissa: | 8 minutes |
| Lucas: | 9 minutes |
| Princeton: | 11 minutes |
| Prosper: | 6 minutes |
| Frisco: | 5 minutes |
| Anna: | 9 minutes |
| Celina: | 9 minutes |
 Based on the reports from the years 2003 - 2018 the average number of fire-related fatalities per year is 1. The highest number of deaths - 3 took place in 2015, and the lowest - 0 in 2004. The data has a decreasing trend.
The average number of fatalities per 1,000 fire incidents is 3. This indicator was the highest - 13 in 2015, and the lowest 0 in 2004. The trend for fatalities per 1,000 incidents is dropping. Compared to the state value the number of deaths per 1,000 incidents is higher.
Based on the reports from the years 2003 - 2018 the average number of fire-related fatalities per year is 1. The highest number of deaths - 3 took place in 2015, and the lowest - 0 in 2004. The data has a decreasing trend.
The average number of fatalities per 1,000 fire incidents is 3. This indicator was the highest - 13 in 2015, and the lowest 0 in 2004. The trend for fatalities per 1,000 incidents is dropping. Compared to the state value the number of deaths per 1,000 incidents is higher.Deaths per 1,000 incidents in McKinney, TX compared to nearest cities:
(Note: Based on data for all years, including only cities with at least 2,500 fire incidents)
| McKinney: | 2.8 |
| Frisco: | 1.3 |
| Plano: | 3.0 |
| Richardson: | 1.5 |
| Garland: | 2.2 |
| Carrollton: | 1.7 |
| Lewisville: | 2.2 |
| Denton: | 0.9 |
| Mesquite: | 0.8 |
 Based on the data from the years 2003 - 2018 the average number of fire-related casualties per year is 6. The highest number of reported casualties - 15 took place in 2003, and the lowest - 1 in 2009. The data has a dropping trend.
The average number of casualties per 1,000 fire incidents is 23. This indicator was the highest - 65 in 2003, and the lowest 5 in 2009. The trend for injuries per 1,000 fires is declining. Compared to the Texas value the number of casualties per 1,000 fire incidents is much higher.
Based on the data from the years 2003 - 2018 the average number of fire-related casualties per year is 6. The highest number of reported casualties - 15 took place in 2003, and the lowest - 1 in 2009. The data has a dropping trend.
The average number of casualties per 1,000 fire incidents is 23. This indicator was the highest - 65 in 2003, and the lowest 5 in 2009. The trend for injuries per 1,000 fires is declining. Compared to the Texas value the number of casualties per 1,000 fire incidents is much higher.
 27.0% incidents where reported in the morning and 73.0% in the evening. The most fires (15.3%) took place on Sunday, and the least (12.6%) on Tuesday.
 According to the 3,943 fire incidents from years 2003 - 2018 most fires (10.6%) took place during January, and the least (6.2%) in September.
 Out of all 62,958 cases reported during the years 2003 - 2018, the most belonged to the categories: Rescue & EMS (64.0%), False Alarm (9.0%), and Hazardous Condition (8.3%).
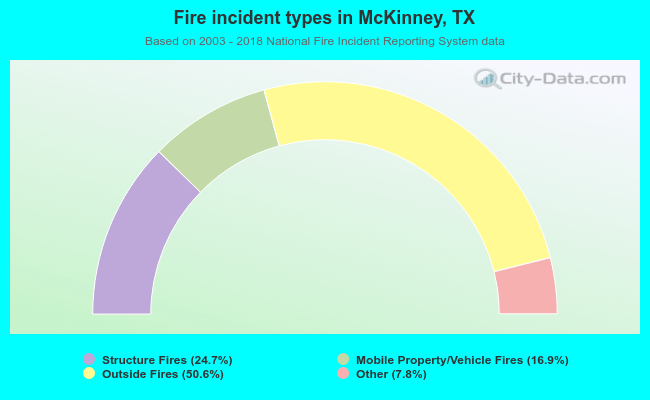 When looking into fire subcategories, the most reports belonged to: Outside Fires (50.6%), and Structure Fires (24.7%).