Newport News: Fire Incidents, Virginia (VA)
Where are fire incidents reported in Newport News, VA
Something went wrong! Please refresh the page.
| Fire incidents reported | |
|---|---|
| Sreet name | Count |
| JEFFERSON AVE | 1,212 |
| WARWICK BLVD | 574 |
| I 64 | 396 |
| J CLYDE MORRIS BLVD | 152 |
| MARSHALL AVE | 122 |
| DENBIGH BLVD | 112 |
| MADISON AVE | 108 |
| CHESTNUT AVE | 102 |
| ROANOKE AVE | 102 |
| BLAND BLVD | 90 |
| WICKHAM AVE | 90 |
| 36TH ST | 88 |
| OLD COURTHOUSE WAY | 88 |
| TURLINGTON RD | 86 |
| HARPERSVILLE RD | 80 |
| LOGAN PL | 78 |
| 16TH ST | 72 |
| ORCUTT AVE | 72 |
| IVY AVE | 70 |
| MARCUS DR | 70 |
| WEST AVE | 70 |
| RIVER RD | 64 |
| AQUEDUCT DR | 62 |
| BELLWOOD RD | 62 |
| GARDEN DR | 62 |
| LUCAS CREEK RD | 62 |
| OYSTER POINT RD | 62 |
| 29TH ST | 60 |
| TYLER AVE | 60 |
| WOODSIDE LN | 60 |
| Other | 2,384 |
2008 - 2018 National Fire Incident Reporting System (NFIRS) incidents
- Incident types reported to NFIRS in Newport News, VA
- 83,89969.2%Rescue & EMS
- 8,7787.2%Service Call
- 8,6287.1%Good Intent Call
- 7,2416.0%Hazardous Condition
- 6,7725.6%Fire
- 5,5494.6%False Alarm
- 1960.2%Special Incident
- Fire incident types reported to NFIRS in Newport News, VA
- 3,04945.0%Structure Fires
- 2,41435.6%Outside Fires
- 1,17817.4%Mobile Property/Vehicle Fires
- 1311.9%Other
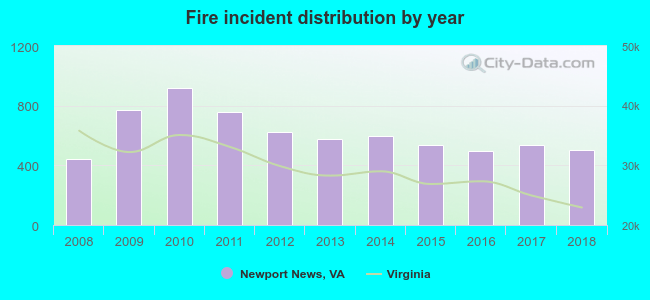 Based on the data from the years 2008 - 2018 the average number of fire incidents per year is 614. The highest number of fire incidents - 916 took place in 2010, and the least - 444 in 2008. The data has a rising trend.
The average number of yearly fire incidents per 10k residents in Newport News, VA compared to nearest cities:
(Note: Based on data for the last 3 years, including only cities with population 5,000 and above)
| Newport News: | 28.0 |
| Hampton: | 28.4 |
| Poquoson: | 23.2 |
| Smithfield: | 57.1 |
| Meadowbrook: | 8.5 |
| Norfolk: | 30.1 |
| Portsmouth: | 39.2 |
| Williamsburg: | 198.5 |
| Brambleton: | 3.6 |
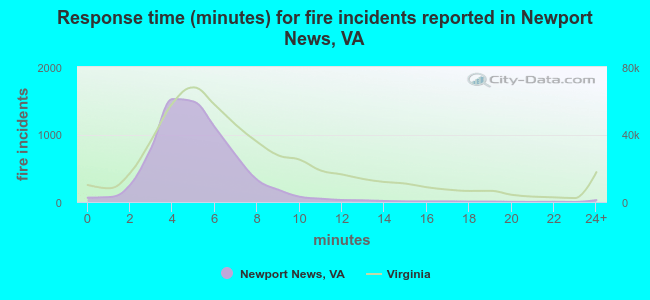 The median response time based on all reported fire incidents is 5 minutes. This is lower than the state median value.
The median response time in Newport News, VA compared to nearest cities:
(Note: Based on data for all years, including only cities with at least 500 fire incidents)
| Newport News: | 5 minutes |
| Hampton: | 5 minutes |
| Poquoson: | 4 minutes |
| Smithfield: | 7 minutes |
| Yorktown: | 5 minutes |
| Norfolk: | 4 minutes |
| Portsmouth: | 5 minutes |
| Williamsburg: | 5 minutes |
| Concord: | 10 minutes |
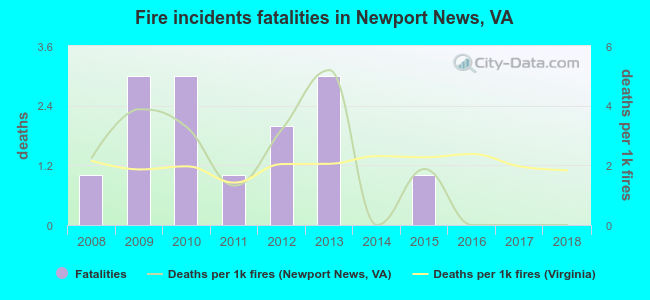 According to the data from the years 2008 - 2018 the average number of fire-related fatalities per year is 1. The highest number of deaths - 3 took place in 2009, and the lowest - 0 in 2014. The data has a decreasing trend.
The average number of fatalities per 1,000 fire incidents is 2. This indicator was the highest - 5 in 2013, and the lowest 0 in 2014. The trend for deaths per 1,000 fire incidents is decreasing. Compared to the state value the number of deaths per 1,000 incidents is similar.
According to the data from the years 2008 - 2018 the average number of fire-related fatalities per year is 1. The highest number of deaths - 3 took place in 2009, and the lowest - 0 in 2014. The data has a decreasing trend.
The average number of fatalities per 1,000 fire incidents is 2. This indicator was the highest - 5 in 2013, and the lowest 0 in 2014. The trend for deaths per 1,000 fire incidents is decreasing. Compared to the state value the number of deaths per 1,000 incidents is similar.Deaths per 1,000 incidents in Newport News, VA compared to nearest cities:
(Note: Based on data for all years, including only cities with at least 2,500 fire incidents)
| Newport News: | 2.1 |
| Hampton: | 2.5 |
| Norfolk: | 1.0 |
| Portsmouth: | 2.1 |
| Williamsburg: | 2.2 |
| Chesapeake: | 2.6 |
| Suffolk: | 1.7 |
| Virginia Beach: | 3.1 |
| Petersburg: | 2.8 |
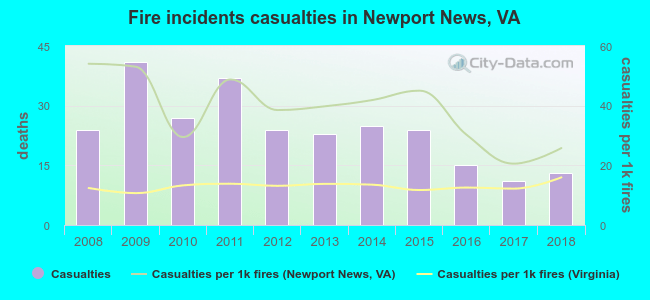 Based on the reports from the years 2008 - 2018 the average number of fire-related casualties per year is 24. The highest number of reported casualties - 41 took place in 2009, and the lowest - 11 in 2017. The data has a dropping trend.
The average number of injuries per 1,000 fire incidents is 39. This indicator was the highest - 54 in 2008, and the lowest 21 in 2017. The trend for casualties per 1,000 fire incidents is decreasing. Compared to the Virginia value the number of casualties per 1,000 fire incidents is much higher.
Based on the reports from the years 2008 - 2018 the average number of fire-related casualties per year is 24. The highest number of reported casualties - 41 took place in 2009, and the lowest - 11 in 2017. The data has a dropping trend.
The average number of injuries per 1,000 fire incidents is 39. This indicator was the highest - 54 in 2008, and the lowest 21 in 2017. The trend for casualties per 1,000 fire incidents is decreasing. Compared to the Virginia value the number of casualties per 1,000 fire incidents is much higher.Casualties per 1,000 incidents in Newport News, VA compared to nearest cities:
(Note: Based on data for all years, including only cities with at least 500 fire incidents)
| Newport News: | 39.0 |
| Hampton: | 19.6 |
| Poquoson: | 17.4 |
| Smithfield: | 4.9 |
| Yorktown: | 22.7 |
| Norfolk: | 9.0 |
| Portsmouth: | 3.9 |
| Williamsburg: | 20.8 |
| Concord: | 0.0 |
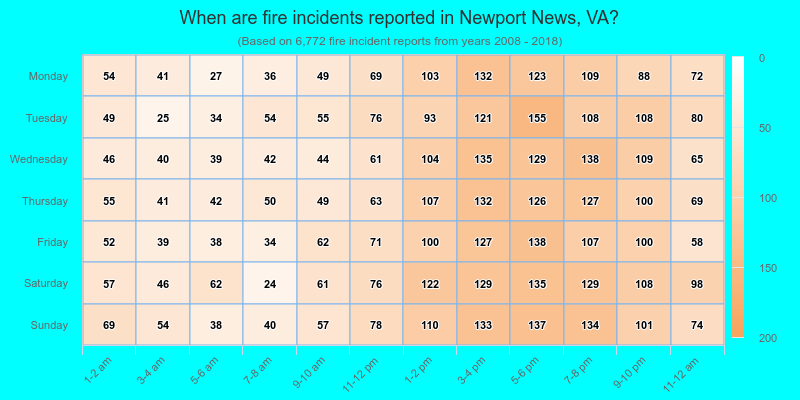
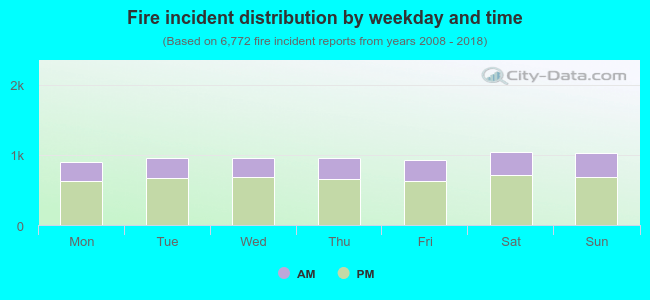 31.0% incidents where reported in the morning and 69.0% in the evening. The most fires (15.5%) took place on Saturday, and the least (13.3%) on Monday.
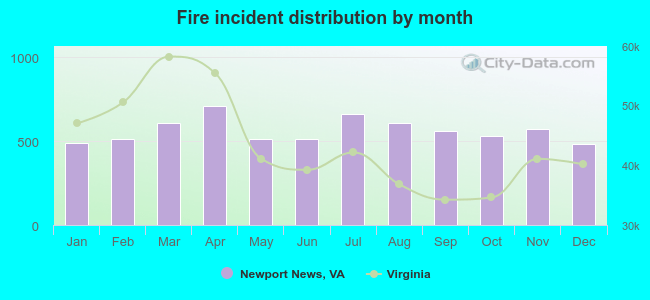 Based on the 6,772 fire incidents from years 2008 - 2018 most fires (10.5%) took place during April, and the least (7.1%) in December.
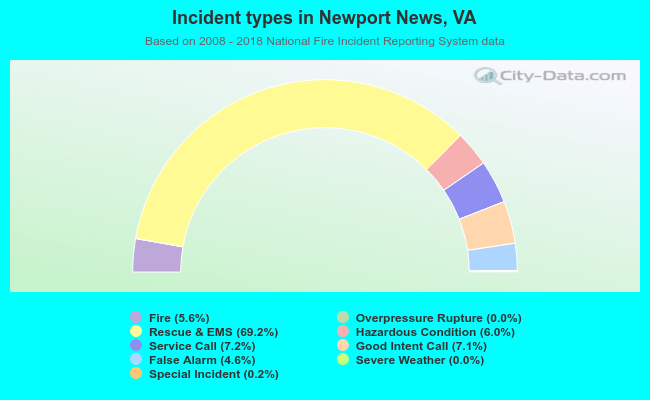 Out of all 121,158 cases reported during the years 2008 - 2018, the most belonged to the categories: Rescue & EMS (69.2%), Service Call (7.2%), and Good Intent Call (7.1%).
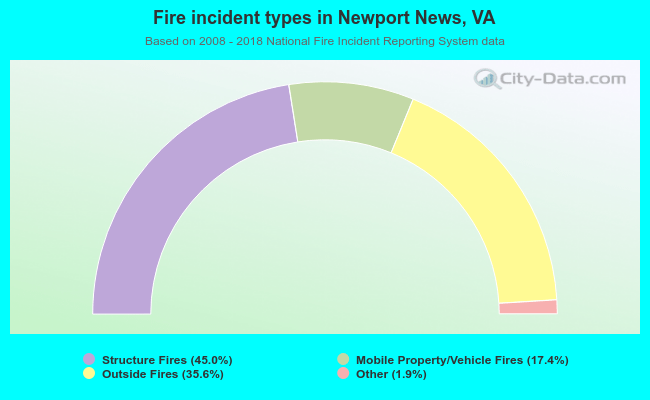 When looking into fire subcategories, the most reports belonged to: Structure Fires (45.0%), and Outside Fires (35.6%).