Olney: Fire Incidents, Maryland (MD)
Where are fire incidents reported in Olney, MD
Something went wrong! Please refresh the page.
|
| |||||||||||||||||||||||||||||||||||||||||||||||||||||||||||||||||||||||||||||||||||||||||||||||||||||||||||||
| Other | 75 | |||||||||||||||||||||||||||||||||||||||||||||||||||||||||||||||||||||||||||||||||||||||||||||||||||||||||||||
2004 - 2018 National Fire Incident Reporting System (NFIRS) incidents
- Incident types reported to NFIRS in Olney, MD
- 6,06567.3%Rescue & EMS
- 8819.8%Good Intent Call
- 7548.4%Hazardous Condition
- 5175.7%Service Call
- 4144.6%False Alarm
- 3614.0%Fire
- 110.1%Overpressure Rupture
- Fire incident types reported to NFIRS in Olney, MD
- 15643.2%Outside Fires
- 13838.2%Structure Fires
- 4111.4%Mobile Property/Vehicle Fires
- 267.2%Other
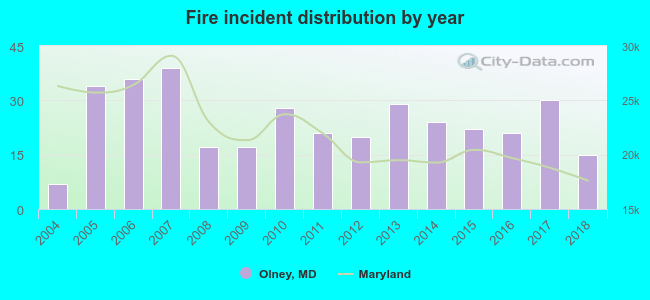 According to the data from the years 2004 - 2018 the average number of fire incidents per year is 24. The highest number of fires - 39 took place in 2007, and the least - 7 in 2004. The data has an increasing trend.
The average number of yearly fire incidents per 10k residents in Olney, MD compared to nearest cities:
(Note: Based on data for the last 3 years, including only cities with population 5,000 and above)
| Olney: | 6.5 |
| Rockville: | 18.6 |
| Colesville: | 14.3 |
| Montgomery Village: | 8.4 |
| Burtonsville: | 30.0 |
| Gaithersburg: | 21.4 |
| North Bethesda: | 2.2 |
| Scaggsville: | 0.4 |
| Germantown: | 10.3 |

 Based on the reports from the years 2004 - 2018 the average number of fire-related yearly casualties is 1. The highest number of injuries - 4 took place in 2015, and the lowest - 0 in 2004. The data has a constant trend.
 31.6% incidents where reported in the morning and 68.4% in the evening. The most fires (19.7%) took place on Saturday, and the least (10.8%) on Wednesday.
 Based on the 361 fire incident reports from years 2004 - 2018 most fires (11.6%) took place during April, and the least (4.2%) in October.
 Out of all 9,012 cases reported during the years 2004 - 2018, the most belonged to the categories: Rescue & EMS (67.3%), Good Intent Call (9.8%), and Hazardous Condition (8.4%).
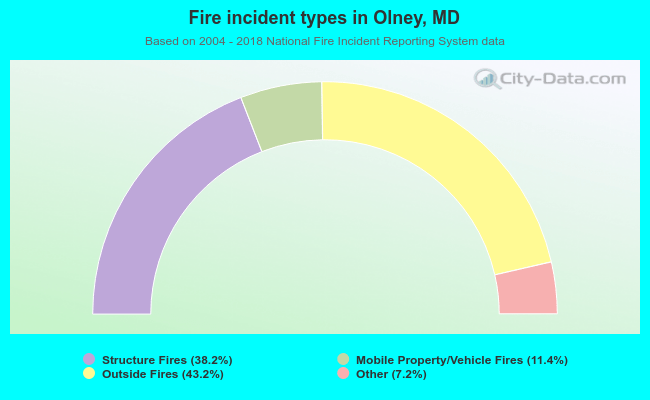 When looking into fire subcategories, the most incidents belonged to: Outside Fires (43.2%), and Structure Fires (38.2%).