Orting: Fire Incidents, Washington (WA)
Where are fire incidents reported in Orting, WA
Something went wrong! Please refresh the page.
|
| |||||||||||||||||||||||||||||||||||||||||||||||||||||||||||||||||||||||||||||||||||||||||||||||||||||||||||||
2002 - 2018 National Fire Incident Reporting System (NFIRS) incidents
- Incident types reported to NFIRS in Orting, WA
- 5,34257.0%Rescue & EMS
- 1,15312.3%Fire
- 1,12512.0%Good Intent Call
- 9319.9%Service Call
- 5035.4%Hazardous Condition
- 2903.1%False Alarm
- 120.1%Special Incident
- Fire incident types reported to NFIRS in Orting, WA
- 52445.4%Structure Fires
- 36331.5%Outside Fires
- 15313.3%Other
- 1139.8%Mobile Property/Vehicle Fires
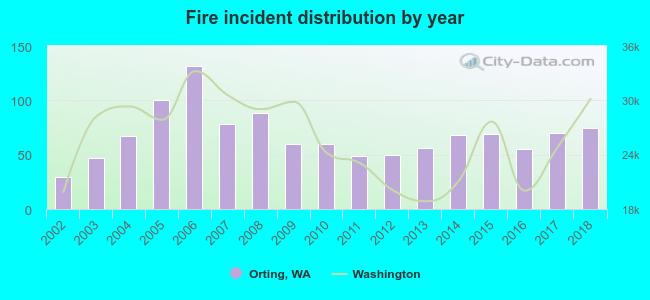 Based on the data from the years 2002 - 2018 the average number of fires per year is 68. The highest number of fire incidents - 132 took place in 2006, and the least - 29 in 2002. The data has an increasing trend.
The average number of yearly fire incidents per 10k residents in Orting, WA compared to nearest cities:
(Note: Based on data for the last 3 years, including only cities with population 5,000 and above)
| Orting: | 91.8 |
| South Hill: | 26.4 |
| Graham: | 38.6 |
| Bonney Lake: | 67.3 |
| Puyallup: | 47.5 |
| Sumner: | 73.0 |
| Lake Tapps: | 10.1 |
| Edgewood: | 24.6 |
| Spanaway: | 42.1 |
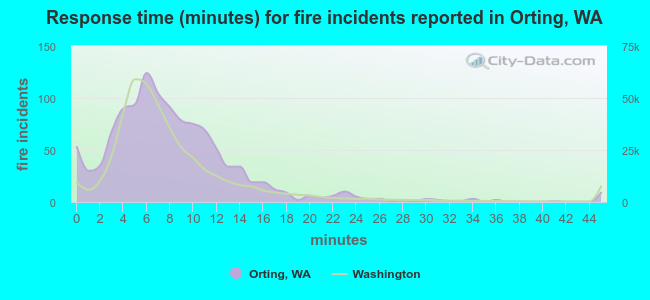 The median response time based on all reported fire incidents is 7 minutes. This is similar to the Washington median value.
The median response time in Orting, WA compared to nearest cities:
(Note: Based on data for all years, including only cities with at least 500 fire incidents)
| Orting: | 7 minutes |
| Graham: | 9 minutes |
| Bonney Lake: | 8 minutes |
| Puyallup: | 7 minutes |
| Sumner: | 8 minutes |
| Buckley: | 8 minutes |
| Edgewood: | 7 minutes |
| Spanaway: | 7 minutes |
| Parkland: | 6 minutes |
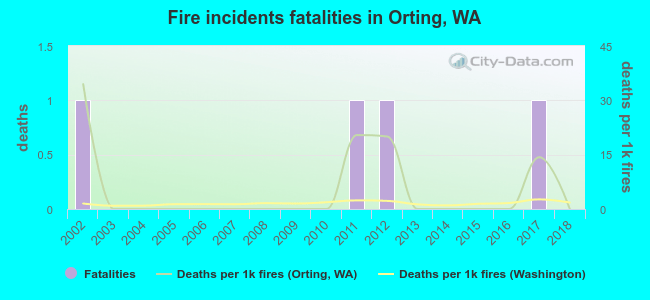 According to the reports from the years 2002 - 2018 the average number of fire-related yearly deaths is 0. The highest number of deaths - 1 took place in 2002, and the lowest - 0 in 2003. The data has a decreasing trend.
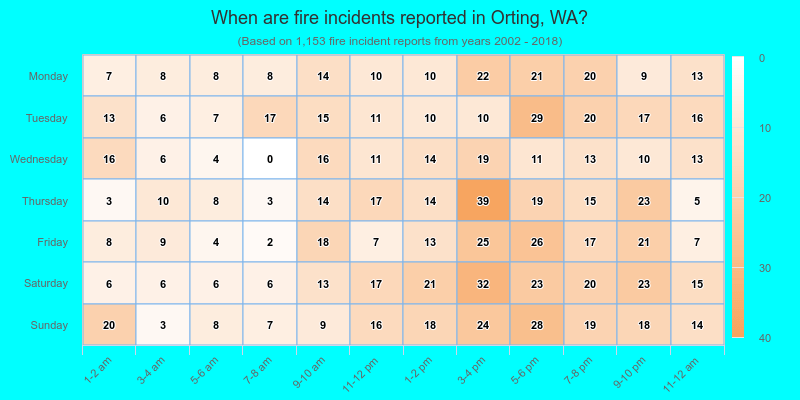
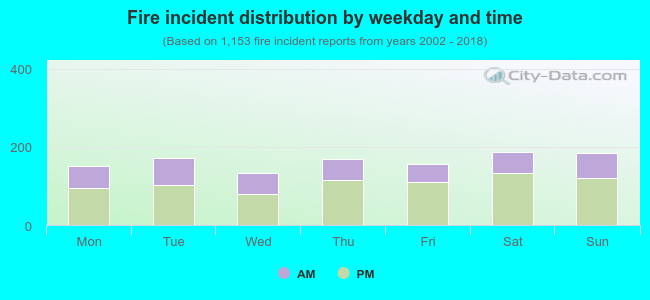 34.4% incidents where reported in the morning and 65.6% in the evening. The most fires (16.3%) took place on Saturday, and the least (11.5%) on Wednesday.
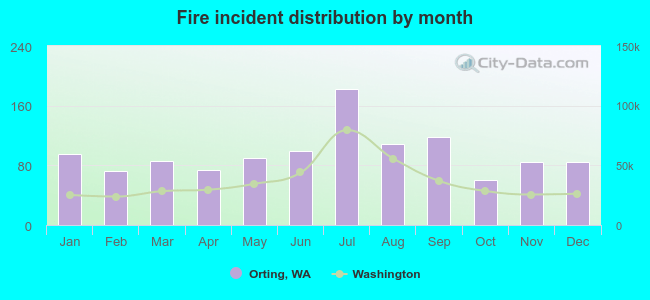 Based on the 1,153 fire incidents from years 2002 - 2018 most fires (15.8%) took place during July, and the least (5.2%) in October.
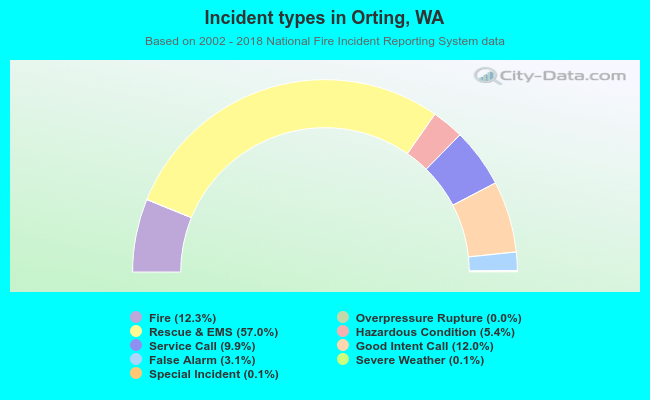 Out of all 9,365 cases reported during the years 2002 - 2018, the most belonged to the categories: Rescue & EMS (57.0%), Fire (12.3%), and Good Intent Call (12.0%).
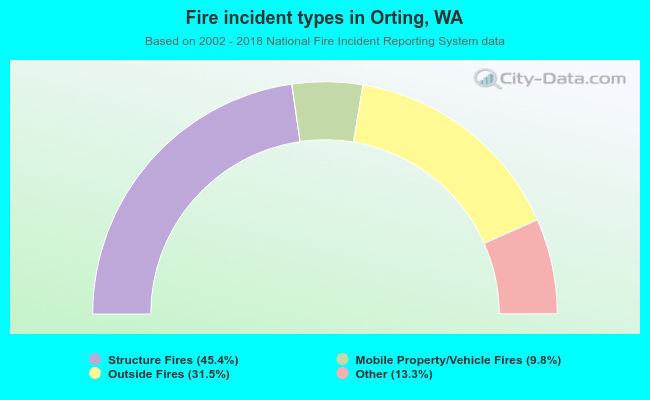 When looking into fire subcategories, the most incidents belonged to: Structure Fires (45.4%), and Outside Fires (31.5%).