Peoria: Fire Incidents, Illinois (IL)
Where are fire incidents reported in Peoria, IL
Something went wrong! Please refresh the page.
| Fire incidents reported | |
|---|---|
| Sreet name | Count |
| ADAMS ST | 410 |
| UNIVERSITY ST | 340 |
| MAIN ST | 260 |
| FARMINGTON RD | 240 |
| KNOXVILLE AVE | 192 |
| SHERIDAN RD | 192 |
| KNOXVILLE AV | 168 |
| GARDEN ST | 166 |
| MONROE ST | 166 |
| HOWETT ST | 144 |
| JEFFERSON AVE | 142 |
| PROSPECT RD | 142 |
| MADISON AVE | 132 |
| STARR ST | 126 |
| LINCOLN AVE | 116 |
| OAKCREST DR | 116 |
| BUTLER ST | 112 |
| MADISON AV | 112 |
| KICKAPOO CREEK RD | 110 |
| MILLMAN ST | 110 |
| WAR MEMORIAL DR | 108 |
| GALENA RD | 104 |
| JEFFERSON AV | 104 |
| PEORIA AVE | 104 |
| PLANK RD | 104 |
| WISWALL ST | 102 |
| ANN ST | 100 |
| STANLEY ST | 100 |
| PROCTOR ST | 94 |
| STERLING AVE | 92 |
| Other | 5,138 |
2002 - 2018 National Fire Incident Reporting System (NFIRS) incidents
- Incident types reported to NFIRS in Peoria, IL
- 69,20870.7%Rescue & EMS
- 9,6469.9%Fire
- 6,7266.9%Hazardous Condition
- 6,5466.7%False Alarm
- 3,0323.1%Service Call
- 2,5452.6%Good Intent Call
- 1280.1%Special Incident
- Fire incident types reported to NFIRS in Peoria, IL
- 4,88850.7%Structure Fires
- 3,01531.3%Outside Fires
- 1,42814.8%Mobile Property/Vehicle Fires
- 3153.3%Other
 According to the data from the years 2002 - 2018 the average number of fires per year is 567. The highest number of fire incidents - 790 took place in 2005, and the least - 55 in 2002. The data has a rising trend.
The average number of yearly fire incidents per 10k residents in Peoria, IL compared to nearest cities:
(Note: Based on data for the last 3 years, including only cities with population 5,000 and above)
| Peoria: | 55.5 |
| Peoria Heights: | 38.8 |
| East Peoria: | 31.7 |
| Creve Coeur: | 26.7 |
| Bartonville: | 21.8 |
| Washington: | 44.0 |
| Pekin: | 53.8 |
| Morton: | 18.6 |
| Chillicothe: | 113.6 |
 The median response time based on all reported fire incidents is 4 minutes. This is lower than the state median value.
The median response time in Peoria, IL compared to nearest cities:
(Note: Based on data for all years, including only cities with at least 500 fire incidents)
| Peoria: | 4 minutes |
| East Peoria: | 5 minutes |
| Washington: | 7 minutes |
| Pekin: | 4 minutes |
| Morton: | 8 minutes |
| Metamora: | 8 minutes |
| Chillicothe: | 9 minutes |
| Canton: | 5 minutes |
 According to the data from the years 2002 - 2018 the average number of fire-related fatalities per year is 1. The highest number of deaths - 6 took place in 2010, and the lowest - 0 in 2002. The data has a rising trend.
The average number of fatalities per 1,000 fire incidents is 2. This indicator was the highest - 9 in 2010, and the lowest 0 in 2002. The trend for deaths per 1,000 incidents is growing. Compared to the state value the number of fatalities per 1,000 fire incidents is higher.
According to the data from the years 2002 - 2018 the average number of fire-related fatalities per year is 1. The highest number of deaths - 6 took place in 2010, and the lowest - 0 in 2002. The data has a rising trend.
The average number of fatalities per 1,000 fire incidents is 2. This indicator was the highest - 9 in 2010, and the lowest 0 in 2002. The trend for deaths per 1,000 incidents is growing. Compared to the state value the number of fatalities per 1,000 fire incidents is higher.Deaths per 1,000 incidents in Peoria, IL compared to nearest cities:
(Note: Based on data for all years, including only cities with at least 2,500 fire incidents)
| Peoria: | 2.6 |
| Pekin: | 4.7 |
 Based on the reports from the years 2002 - 2018 the average number of fire-related casualties per year is 10. The highest number of injuries - 23 took place in 2007, and the lowest - 0 in 2002. The data has a growing trend.
The average number of casualties per 1,000 fires is 18. This indicator was the highest - 37 in 2007, and the lowest 0 in 2002. The trend for casualties per 1,000 incidents is growing. Compared to the state value the number of casualties per 1,000 fires is higher.
Based on the reports from the years 2002 - 2018 the average number of fire-related casualties per year is 10. The highest number of injuries - 23 took place in 2007, and the lowest - 0 in 2002. The data has a growing trend.
The average number of casualties per 1,000 fires is 18. This indicator was the highest - 37 in 2007, and the lowest 0 in 2002. The trend for casualties per 1,000 incidents is growing. Compared to the state value the number of casualties per 1,000 fires is higher.Casualties per 1,000 incidents in Peoria, IL compared to nearest cities:
(Note: Based on data for all years, including only cities with at least 500 fire incidents)
| Peoria: | 17.2 |
| East Peoria: | 12.3 |
| Washington: | 8.7 |
| Pekin: | 21.5 |
| Morton: | 29.1 |
| Metamora: | 1.9 |
| Chillicothe: | 0.0 |
| Canton: | 12.3 |
 30.9% incidents where reported in the morning and 69.1% in the evening. The most fires (15.4%) took place on Saturday, and the least (13.0%) on Friday.
 According to the 9,646 fires from years 2002 - 2018 most fires (11.0%) took place during July, and the least (5.5%) in February.
 Out of all 97,924 cases reported during the years 2002 - 2018, the most belonged to the categories: Rescue & EMS (70.7%), Fire (9.9%), and Hazardous Condition (6.9%).
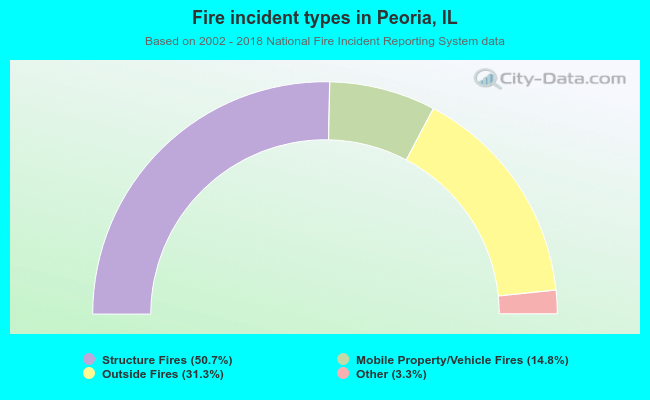 When looking into fire subcategories, the most reports belonged to: Structure Fires (50.7%), and Outside Fires (31.3%).