Providence: Fire Incidents, Rhode Island (RI)
Where are fire incidents reported in Providence, RI
Something went wrong! Please refresh the page.
| Fire incidents reported | |
|---|---|
| Sreet name | Count |
| ELMWOOD AVE | 172 |
| BROAD ST | 154 |
| MAIN ST | 132 |
| SMITH ST | 102 |
| WESTMINSTER ST | 94 |
| CHARLES ST | 88 |
| DOUGLAS AVE | 70 |
| CRANSTON ST | 66 |
| OAKLAND AVE | 60 |
| 95 | 58 |
| CHALKSTONE AVE | 54 |
| BRANCH AVE | 52 |
| MANTON AVE | 52 |
| PEMBROKE AVE | 48 |
| ANGELL ST | 44 |
| EATON ST | 44 |
| HARTFORD AVE | 44 |
| ALLENS AVE | 42 |
| CADILLAC DR | 42 |
| WATERMAN ST | 42 |
| HOPE ST | 38 |
| UNION AVE | 38 |
| VEAZIE ST | 38 |
| ADMIRAL ST | 36 |
| DODGE ST | 36 |
| EDDY ST | 36 |
| ATWELLS AVE | 34 |
| PLAINFIELD ST | 34 |
| PRAIRIE AVE | 34 |
| ADELAIDE AVE | 32 |
| Other | 1,088 |
2004 - 2018 National Fire Incident Reporting System (NFIRS) incidents
- Incident types reported to NFIRS in Providence, RI
- 22,11553.2%Rescue & EMS
- 8,04519.4%False Alarm
- 4,20310.1%Hazardous Condition
- 2,9047.0%Fire
- 2,3095.6%Good Intent Call
- 1,8894.5%Service Call
- Fire incident types reported to NFIRS in Providence, RI
- 1,51952.3%Structure Fires
- 93032.0%Outside Fires
- 2889.9%Mobile Property/Vehicle Fires
- 1675.8%Other
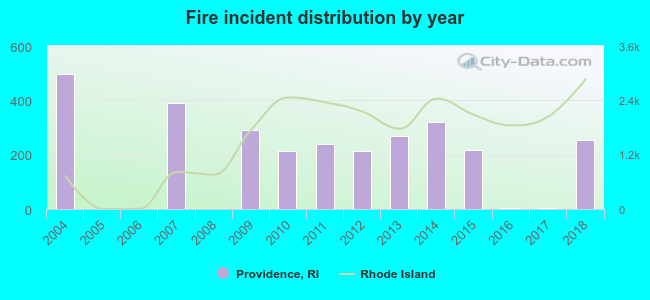 Based on the data from the years 2004 - 2018 the average number of fire incidents per year is 194. The highest number of fires - 496 took place in 2004, and the least - 0 in 2005. The data has a dropping trend.
The average number of yearly fire incidents per 10k residents in Providence, RI compared to nearest cities:
(Note: Based on data for the last 3 years, including only cities with population 5,000 and above)
| Providence: | 4.8 |
| East Providence: | 21.7 |
| Johnston: | 26.6 |
| Cranston: | 25.6 |
| Pawtucket: | 0.3 |
| Central Falls: | 96.2 |
| Lincoln: | 31.0 |
| Warwick: | 0.3 |
| Smithfield: | 27.7 |
 The median response time based on all reported fire incidents is 5 minutes. This is close to the state median value.
The median response time in Providence, RI compared to nearest cities:
(Note: Based on data for all years, including only cities with at least 500 fire incidents)
| Providence: | 5 minutes |
| North Providence: | 4 minutes |
| East Providence: | 5 minutes |
| Cranston: | 4 minutes |
| Central Falls: | 2 minutes |
| Seekonk: | 6 minutes |
| Lincoln: | 4 minutes |
| Warwick: | 4 minutes |
| Smithfield: | 6 minutes |
 31.5% incidents where reported in the morning and 68.5% in the evening. The most fires (16.3%) took place on Sunday, and the least (12.1%) on Tuesday.
 Based on the 2,904 fire incidents from years 2004 - 2018 most fires (15.5%) took place during May, and the least (4.4%) in December.
 Out of all 41,540 cases reported during the years 2004 - 2018, the most belonged to the categories: Rescue & EMS (53.2%), False Alarm (19.4%), and Hazardous Condition (10.1%).
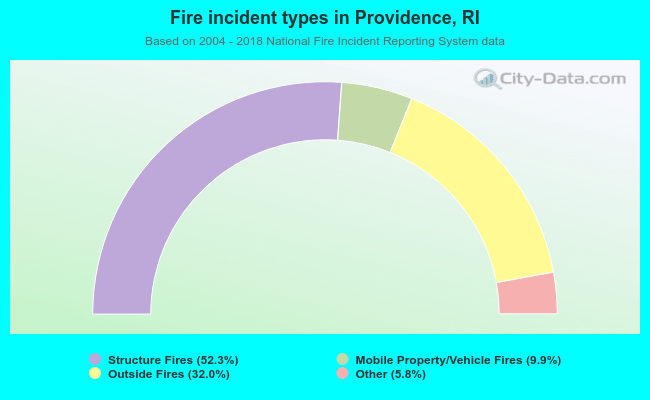 When looking into fire subcategories, the most incidents belonged to: Structure Fires (52.3%), and Outside Fires (32.0%).