Red Oak: Fire Incidents, Texas (TX)
Where are fire incidents reported in Red Oak, TX
Something went wrong! Please refresh the page.
| Fire incidents reported | |
|---|---|
| Sreet name | Count |
| OVILLA RD | 220 |
| INTERSTATE 35 E | 148 |
| BOND ST | 100 |
| PIERCE RD | 68 |
| BELLS CHAPEL RD | 52 |
| PRESTON RD | 52 |
| LEE ST | 50 |
| RED OAK RD | 48 |
| HWY 342 | 44 |
| CEDAR RIDGE DR | 36 |
| PRATT RD | 36 |
| STAINBACK RD | 36 |
| FM 2377 | 32 |
| I35E NB SOUTH OF RO RD | 32 |
| METHODIST ST | 32 |
| CEDAR VIEW DR | 30 |
| I35E SB SOUTH OF RO RD | 30 |
| LINK ST | 30 |
| CRUMP CIR | 28 |
| METHODIST | 28 |
| SHELBY CIR | 28 |
| COLE RD | 26 |
| ELLIS ST | 26 |
| HOUSTON SCHOOL RD | 26 |
| STATE HIGHWAY 342 | 26 |
| BELLS CHAPEL CIR | 24 |
| BRUSHY CREEK RD | 24 |
| FM 813 | 24 |
| FM 983 | 24 |
| HARRIS AVE | 24 |
| Other | 677 |
2002 - 2018 National Fire Incident Reporting System (NFIRS) incidents
- Incident types reported to NFIRS in Red Oak, TX
- 7,99255.3%Rescue & EMS
- 2,06114.3%Fire
- 1,4179.8%Good Intent Call
- 1,3069.0%Service Call
- 1,0367.2%Hazardous Condition
- 5914.1%False Alarm
- 180.1%Overpressure Rupture
- 160.1%Severe Weather
- Fire incident types reported to NFIRS in Red Oak, TX
- 1,12054.3%Outside Fires
- 64631.3%Structure Fires
- 22911.1%Mobile Property/Vehicle Fires
- 663.2%Other
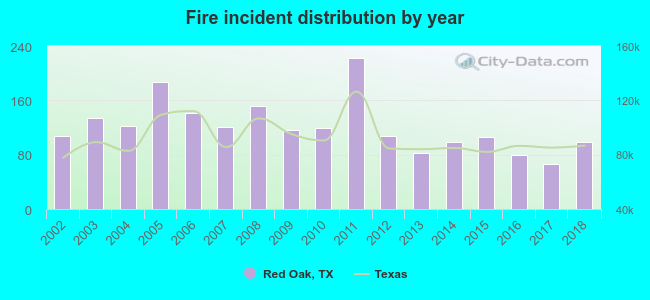 According to the data from the years 2002 - 2018 the average number of fires per year is 121. The highest number of reported fires - 223 took place in 2011, and the least - 66 in 2017. The data has a declining trend.
The average number of yearly fire incidents per 10k residents in Red Oak, TX compared to nearest cities:
(Note: Based on data for the last 3 years, including only cities with population 5,000 and above)
| Red Oak: | 70.4 |
| Glenn Heights: | 40.3 |
| Lancaster: | 43.2 |
| DeSoto: | 30.4 |
| Waxahachie: | 49.2 |
| Cedar Hill: | 34.2 |
| Hutchins: | 76.1 |
| Duncanville: | 46.6 |
| Midlothian: | 68.0 |
 The median response time based on all reported fire incidents is 6 minutes. This is about the same as the Texas median value.
The median response time in Red Oak, TX compared to nearest cities:
(Note: Based on data for all years, including only cities with at least 500 fire incidents)
| Red Oak: | 6 minutes |
| Glenn Heights: | 5 minutes |
| Lancaster: | 6 minutes |
| DeSoto: | 6 minutes |
| Ferris: | 10 minutes |
| Wilmer: | 6 minutes |
| Waxahachie: | 5 minutes |
| Cedar Hill: | 6 minutes |
| Hutchins: | 6 minutes |
 According to the data from the years 2002 - 2018 the average number of fire-related yearly deaths is 0. The highest number of reported deaths - 2 took place in 2007, and the lowest - 0 in 2002. The data has a constant trend.
 According to the data from the years 2002 - 2018 the average number of fire-related yearly casualties is 1. The highest number of reported injuries - 3 took place in 2014, and the lowest - 0 in 2004. The data has a declining trend.
The average number of injuries per 1,000 fires is 5. This indicator was the highest - 31 in 2014, and the lowest 0 in 2004. The trend for injuries per 1,000 incidents is dropping. Compared to the state value the number of injuries per 1,000 fire incidents is lower.
According to the data from the years 2002 - 2018 the average number of fire-related yearly casualties is 1. The highest number of reported injuries - 3 took place in 2014, and the lowest - 0 in 2004. The data has a declining trend.
The average number of injuries per 1,000 fires is 5. This indicator was the highest - 31 in 2014, and the lowest 0 in 2004. The trend for injuries per 1,000 incidents is dropping. Compared to the state value the number of injuries per 1,000 fire incidents is lower.Casualties per 1,000 incidents in Red Oak, TX compared to nearest cities:
(Note: Based on data for all years, including only cities with at least 500 fire incidents)
| Red Oak: | 5.3 |
| Glenn Heights: | 13.0 |
| Lancaster: | 15.5 |
| DeSoto: | 15.3 |
| Ferris: | 8.9 |
| Wilmer: | 2.1 |
| Waxahachie: | 15.5 |
| Cedar Hill: | 13.7 |
| Hutchins: | 9.0 |
 24.3% incidents where reported in the morning and 75.7% in the evening. The most fires (18.0%) took place on Saturday, and the least (12.0%) on Thursday.
 Based on the 2,061 fires from years 2002 - 2018 most fires (11.2%) took place during July, and the least (6.0%) in May.
 Out of all 14,446 cases reported during the years 2002 - 2018, the most belonged to the categories: Rescue & EMS (55.3%), Fire (14.3%), and Good Intent Call (9.8%).
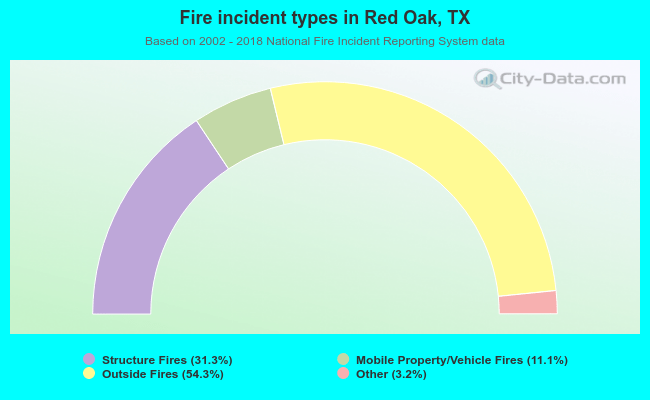 When looking into fire subcategories, the most reports belonged to: Outside Fires (54.3%), and Structure Fires (31.3%).