San Marcos: Fire Incidents, Texas (TX)
Where are fire incidents reported in San Marcos, TX
Something went wrong! Please refresh the page.
| Fire incidents reported | |
|---|---|
| Sreet name | Count |
| IH-35 | 618 |
| AQUARENA SPRINGS DR | 218 |
| IH 35 | 198 |
| HWY 123 | 142 |
| WONDER WORLD DR | 132 |
| LBJ DR | 130 |
| HOPKINS ST | 124 |
| HWY 80 | 120 |
| IH35 | 120 |
| RIVER RD | 120 |
| POST RD | 118 |
| HUNTER RD | 100 |
| CRADDOCK AVE | 92 |
| TEXAS STATE UNIVERSITY | 92 |
| HILLIARD RD | 78 |
| RANCH ROAD 12 | 78 |
| HWY 21 | 64 |
| OLD RANCH ROAD 12 | 64 |
| RR-12 | 64 |
| MILL ST | 60 |
| THORPE LN | 60 |
| CENTERPOINT RD | 58 |
| 21 HWY | 52 |
| GUADALUPE ST | 52 |
| REDWOOD RD | 52 |
| LEAH AVE | 50 |
| NB35 IH | 50 |
| HARRIS HILL RD | 48 |
| MCCARTY LN | 48 |
| UHLAND RD | 48 |
| Other | 457 |
2003 - 2018 National Fire Incident Reporting System (NFIRS) incidents
- Incident types reported to NFIRS in San Marcos, TX
- 14,26944.8%Rescue & EMS
- 6,20719.5%Good Intent Call
- 3,70711.6%Fire
- 3,56911.2%Hazardous Condition
- 2,2357.0%Service Call
- 1,7815.6%False Alarm
- 490.2%Special Incident
- 380.1%Overpressure Rupture
- Fire incident types reported to NFIRS in San Marcos, TX
- 1,98753.6%Outside Fires
- 1,02127.5%Structure Fires
- 65117.6%Mobile Property/Vehicle Fires
- 481.3%Other
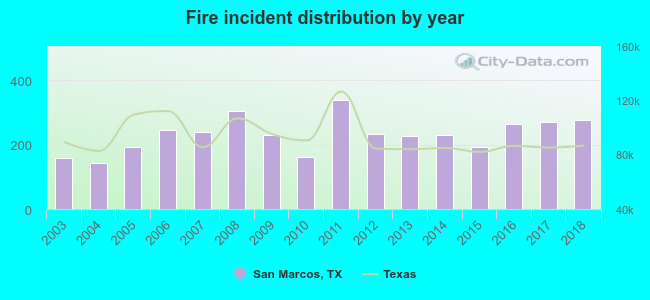 According to the data from the years 2003 - 2018 the average number of fire incidents per year is 232. The highest number of reported fires - 337 took place in 2011, and the least - 143 in 2004. The data has a growing trend.
The average number of yearly fire incidents per 10k residents in San Marcos, TX compared to nearest cities:
(Note: Based on data for the last 3 years, including only cities with population 5,000 and above)
| San Marcos: | 45.9 |
| Kyle: | 50.3 |
| Buda: | 87.3 |
| Lockhart: | 41.1 |
| New Braunfels: | 35.5 |
| Canyon Lake: | 56.0 |
| Seguin: | 98.9 |
| Luling: | 121.5 |
| Cibolo: | 29.5 |
 The median response time based on all reported fire incidents is 6 minutes. This is close to the Texas median value.
The median response time in San Marcos, TX compared to nearest cities:
(Note: Based on data for all years, including only cities with at least 500 fire incidents)
| San Marcos: | 6 minutes |
| Kyle: | 6 minutes |
| Wimberley: | 11 minutes |
| Buda: | 6 minutes |
| Lockhart: | 5 minutes |
| New Braunfels: | 7 minutes |
| Canyon Lake: | 9 minutes |
| Seguin: | 8 minutes |
| Luling: | 8 minutes |
 According to the reports from the years 2003 - 2018 the average number of fire-related casualties per year is 1. The highest number of reported injuries - 4 took place in 2007, and the lowest - 0 in 2010. The data has a decreasing trend.
The average number of casualties per 1,000 fires is 6. This indicator was the highest - 17 in 2007, and the lowest 0 in 2010. The trend for injuries per 1,000 fires is declining. Compared to the state value the number of injuries per 1,000 incidents is lower.
According to the reports from the years 2003 - 2018 the average number of fire-related casualties per year is 1. The highest number of reported injuries - 4 took place in 2007, and the lowest - 0 in 2010. The data has a decreasing trend.
The average number of casualties per 1,000 fires is 6. This indicator was the highest - 17 in 2007, and the lowest 0 in 2010. The trend for injuries per 1,000 fires is declining. Compared to the state value the number of injuries per 1,000 incidents is lower.Casualties per 1,000 incidents in San Marcos, TX compared to nearest cities:
(Note: Based on data for all years, including only cities with at least 500 fire incidents)
| San Marcos: | 5.7 |
| Kyle: | 0.5 |
| Wimberley: | 1.2 |
| Buda: | 1.6 |
| Lockhart: | 19.9 |
| New Braunfels: | 11.2 |
| Canyon Lake: | 2.2 |
| Seguin: | 11.7 |
| Luling: | 0.0 |
 29.1% incidents where reported in the morning and 70.9% in the evening. The most fires (16.8%) took place on Saturday, and the least (12.8%) on Tuesday.
 According to the 3,707 fire incidents from years 2003 - 2018 most fires (10.7%) took place during August, and the least (6.7%) in November.
 Out of all 31,878 cases reported during the years 2003 - 2018, the most belonged to the categories: Rescue & EMS (44.8%), Good Intent Call (19.5%), and Fire (11.6%).
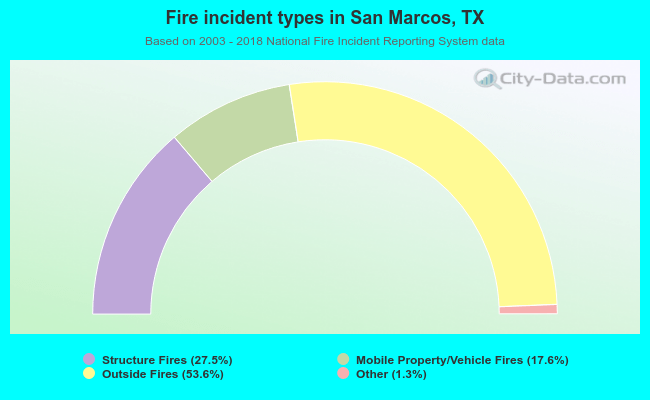 When looking into fire subcategories, the most reports belonged to: Outside Fires (53.6%), and Structure Fires (27.5%).