Sunland Park: Fire Incidents, New Mexico (NM)
Where are fire incidents reported in Sunland Park, NM
Something went wrong! Please refresh the page.
|
| |||||||||||||||||||||||||||||||||||||||||||||||||||||||||||||||||||||||||||||||||||||||||||||||||||||||||||||
2008 - 2018 National Fire Incident Reporting System (NFIRS) incidents
- Incident types reported to NFIRS in Sunland Park, NM
- 3,77067.2%Rescue & EMS
- 5569.9%Service Call
- 4998.9%Good Intent Call
- 3175.7%Fire
- 2785.0%Hazardous Condition
- 1532.7%False Alarm
- 210.4%Special Incident
- 130.2%Severe Weather
- Fire incident types reported to NFIRS in Sunland Park, NM
- 12940.7%Outside Fires
- 10031.5%Structure Fires
- 4413.9%Mobile Property/Vehicle Fires
- 4413.9%Other
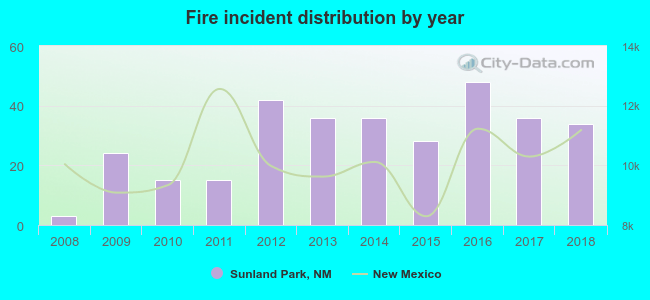 According to the data from the years 2008 - 2018 the average number of fires per year is 29. The highest number of reported fires - 48 took place in 2016, and the least - 3 in 2008. The data has a rising trend.
The average number of yearly fire incidents per 10k residents in Sunland Park, NM compared to nearest cities:
(Note: Based on data for the last 3 years, including only cities with population 5,000 and above)
| Sunland Park: | 25.5 |
| Anthony: | 60.5 |
| Chaparral: | 92.3 |
| Las Cruces: | 24.8 |
| Fairacres: | 59.4 |
| Deming: | 84.9 |
| Alamogordo: | 39.8 |

 32.2% incidents where reported in the morning and 67.8% in the evening. The most fires (17.4%) took place on Wednesday, and the least (12.6%) on Sunday.
 Based on the 317 fires from years 2008 - 2018 most fires (10.4%) took place during August, and the least (4.1%) in September.
 Out of all 5,610 cases reported during the years 2008 - 2018, the most belonged to the categories: Rescue & EMS (67.2%), Service Call (9.9%), and Good Intent Call (8.9%).
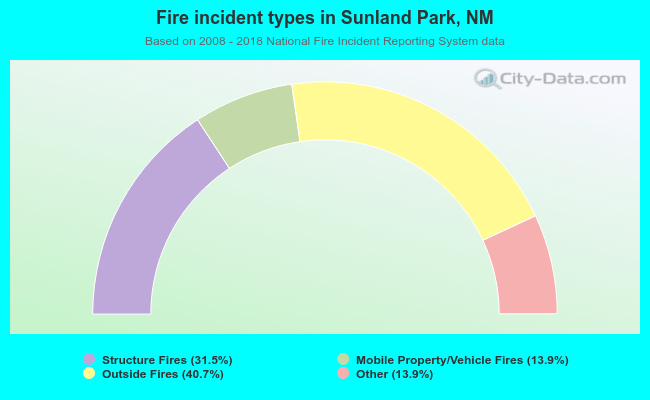 When looking into fire subcategories, the most incidents belonged to: Outside Fires (40.7%), and Structure Fires (31.5%).