Tahuya: Fire Incidents, Washington (WA)
Where are fire incidents reported in Tahuya, WA
Something went wrong! Please refresh the page.
|
| |||||||||||||||||||||||||||||||||||||||||||||||||||||||||||||||||||||||||||||||||||||||||||||||||||||||||||||
2003 - 2018 National Fire Incident Reporting System (NFIRS) incidents
- Incident types reported to NFIRS in Tahuya, WA
- 76456.5%Rescue & EMS
- 29421.7%Service Call
- 1289.5%Fire
- 1108.1%Good Intent Call
- 282.1%False Alarm
- 221.6%Hazardous Condition
- 60.4%Special Incident
- Fire incident types reported to NFIRS in Tahuya, WA
- 5341.4%Outside Fires
- 4333.6%Structure Fires
- 1814.1%Mobile Property/Vehicle Fires
- 1410.9%Other
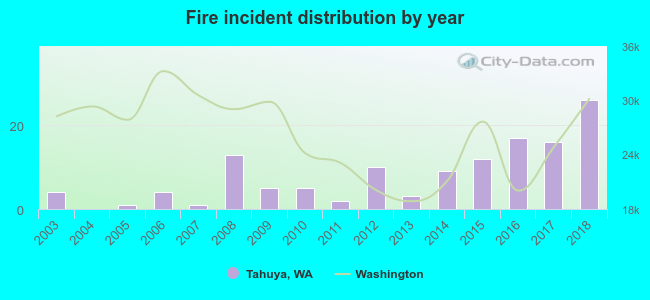 Based on the data from the years 2003 - 2018 the average number of fire incidents per year is 8. The highest number of fires - 26 took place in 2018, and the least - 0 in 2004. The data has a rising trend.
The average number of yearly fire incidents per 10k residents in Tahuya, WA compared to nearest cities:
(Note: Based on data for the last 3 years, including only cities with population 5,000 and above)
| Tahuya: | 32.4 |
| Belfair: | 138.8 |
| Olympic: | 1.6 |
| Port Orchard: | 133.7 |
| Bremerton: | 80.3 |
| Shelton: | 368.9 |
| Gig Harbor: | 86.8 |
| Silverdale: | 41.8 |
| Manchester: | 1.8 |
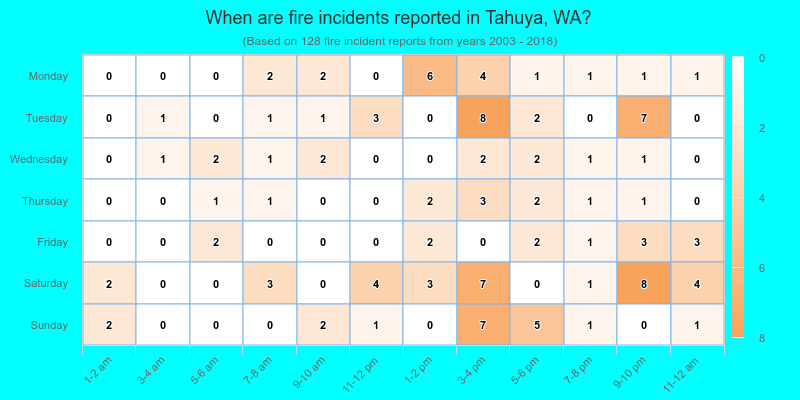
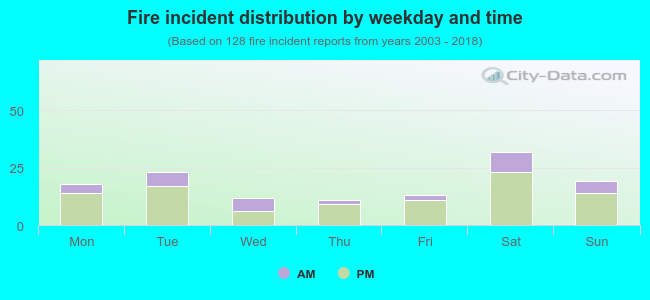 26.6% incidents where reported in the morning and 73.4% in the evening. The most fires (25.0%) took place on Saturday, and the least (8.6%) on Thursday.
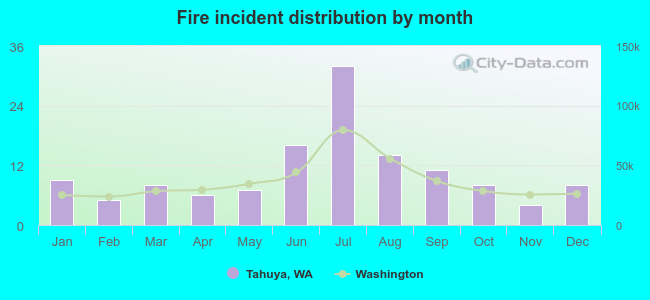 Based on the 128 fire incidents from years 2003 - 2018 most fires (25.0%) took place during July, and the least (3.1%) in November.
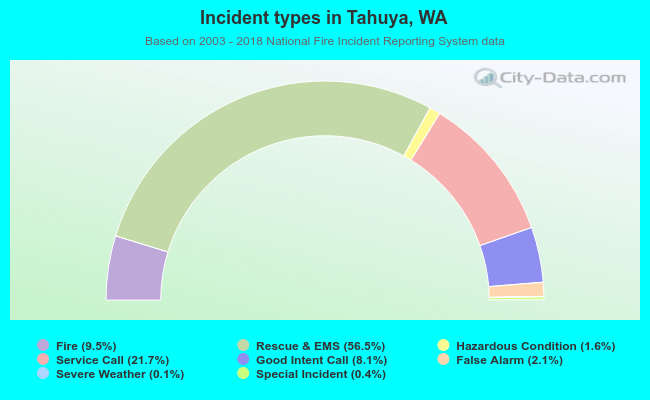 Out of all 1,353 cases reported during the years 2003 - 2018, the most belonged to the categories: Overpressure Rupture (56.5%), Hazardous Condition (21.7%), and Fire (9.5%).
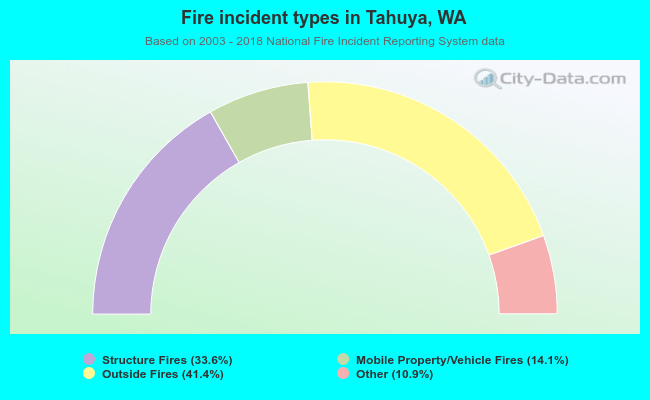 When looking into fire subcategories, the most reports belonged to: Outside Fires (41.4%), and Structure Fires (33.6%).