Waco: Fire Incidents, Texas (TX)
Where are fire incidents reported in Waco, TX
Something went wrong! Please refresh the page.
| Fire incidents reported | |
|---|---|
| Sreet name | Count |
| LAKE SHORE DR | 434 |
| WACO DR | 390 |
| VALLEY MILLS DR | 332 |
| 5TH ST | 220 |
| 19TH ST | 218 |
| 11TH ST | 210 |
| 18TH ST | 206 |
| UNIVERSITY PARKS DR | 198 |
| LOOP 340 | 194 |
| 9TH ST | 184 |
| SANGER AV | 184 |
| 6TH ST | 178 |
| 10TH ST | 176 |
| GHOLSON RD | 170 |
| 12TH ST | 164 |
| 21ST ST | 156 |
| JACK KULTGEN EX | 148 |
| IH 35 | 140 |
| 17TH ST | 138 |
| 25TH ST | 138 |
| SPRING ST | 136 |
| HERRING AV | 132 |
| 4TH ST | 126 |
| 3RD ST | 124 |
| FRANKLIN AV | 124 |
| 8TH ST | 120 |
| 16TH ST | 112 |
| BOSQUE | 112 |
| 7TH ST | 110 |
| J J FLEWELLEN RD | 108 |
| Other | 5,180 |
2002 - 2018 National Fire Incident Reporting System (NFIRS) incidents
- Incident types reported to NFIRS in Waco, TX
- 37,50250.2%Rescue & EMS
- 10,56214.1%Fire
- 10,38813.9%Hazardous Condition
- 5,8177.8%Good Intent Call
- 5,6157.5%False Alarm
- 4,6906.3%Service Call
- 980.1%Overpressure Rupture
- 780.1%Special Incident
- Fire incident types reported to NFIRS in Waco, TX
- 4,79745.4%Outside Fires
- 3,58734.0%Structure Fires
- 1,87417.7%Mobile Property/Vehicle Fires
- 3042.9%Other
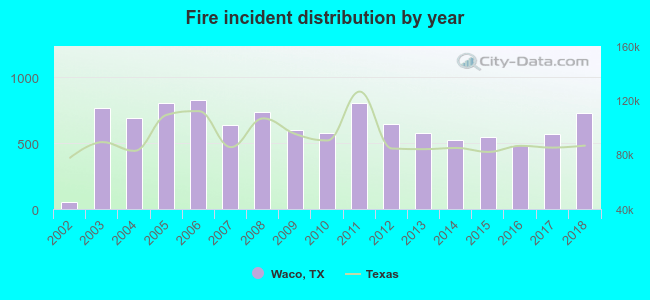 According to the data from the years 2002 - 2018 the average number of fires per year is 621. The highest number of fire incidents - 825 took place in 2006, and the least - 52 in 2002. The data has a growing trend.
The average number of yearly fire incidents per 10k residents in Waco, TX compared to nearest cities:
(Note: Based on data for the last 3 years, including only cities with population 5,000 and above)
| Waco: | 45.7 |
| Bellmead: | 92.3 |
| Woodway: | 19.0 |
| Robinson: | 44.1 |
| Hewitt: | 17.6 |
| Elm Mott: | 69.7 |
| McGregor: | 8.6 |
| Marlin: | 62.7 |
| Hillsboro: | 103.8 |
 The median response time based on all reported fire incidents is 4 minutes. This is lower compared to the state median value.
The median response time in Waco, TX compared to nearest cities:
(Note: Based on data for all years, including only cities with at least 500 fire incidents)
| Waco: | 4 minutes |
| Bellmead: | 5 minutes |
| Robinson: | 9 minutes |
| Hewitt: | 7 minutes |
| West: | 5 minutes |
| Marlin: | 3 minutes |
| Whitney: | 9 minutes |
| Hillsboro: | 7 minutes |
| Temple: | 6 minutes |
 Based on the reports from the years 2002 - 2018 the average number of fire-related yearly deaths is 2. The highest number of deaths - 6 took place in 2006, and the lowest - 0 in 2002. The data has a rising trend.
The average number of deaths per 1,000 fire incidents is 3. This indicator was the highest - 9 in 2012, and the lowest 0 in 2002. The trend for deaths per 1,000 incidents is rising. Compared to the state value the number of deaths per 1,000 incidents is higher.
Based on the reports from the years 2002 - 2018 the average number of fire-related yearly deaths is 2. The highest number of deaths - 6 took place in 2006, and the lowest - 0 in 2002. The data has a rising trend.
The average number of deaths per 1,000 fire incidents is 3. This indicator was the highest - 9 in 2012, and the lowest 0 in 2002. The trend for deaths per 1,000 incidents is rising. Compared to the state value the number of deaths per 1,000 incidents is higher.Deaths per 1,000 incidents in Waco, TX compared to nearest cities:
(Note: Based on data for all years, including only cities with at least 2,500 fire incidents)
| Waco: | 3.1 |
| Temple: | 2.9 |
| Gatesville: | 2.9 |
| Killeen: | 1.8 |
 Based on the data from the years 2002 - 2018 the average number of fire-related casualties per year is 10. The highest number of reported casualties - 21 took place in 2006, and the lowest - 0 in 2002. The data has a growing trend.
The average number of casualties per 1,000 fire incidents is 15. This indicator was the highest - 33 in 2010, and the lowest 0 in 2002. The trend for casualties per 1,000 fires is rising. Compared to the Texas value the number of casualties per 1,000 incidents is much higher.
Based on the data from the years 2002 - 2018 the average number of fire-related casualties per year is 10. The highest number of reported casualties - 21 took place in 2006, and the lowest - 0 in 2002. The data has a growing trend.
The average number of casualties per 1,000 fire incidents is 15. This indicator was the highest - 33 in 2010, and the lowest 0 in 2002. The trend for casualties per 1,000 fires is rising. Compared to the Texas value the number of casualties per 1,000 incidents is much higher.
 31.5% incidents where reported in the morning and 68.5% in the evening. The most fires (15.0%) took place on Saturday, and the least (13.7%) on Wednesday.
 Based on the 10,562 incident reports from years 2002 - 2018 most fires (10.8%) took place during July, and the least (7.0%) in October.
 Out of all 74,776 cases reported during the years 2002 - 2018, the most belonged to the categories: Rescue & EMS (50.2%), Fire (14.1%), and Hazardous Condition (13.9%).
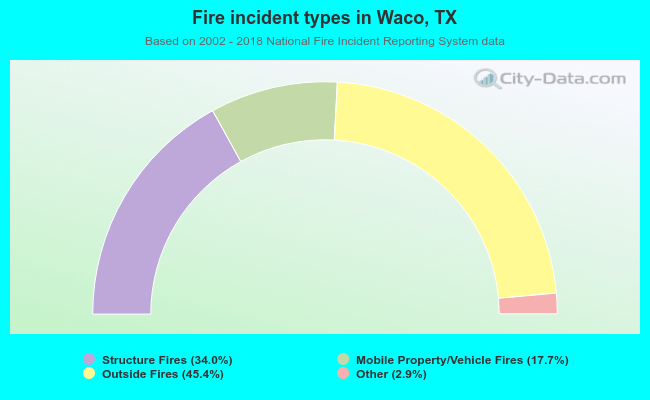 When looking into fire subcategories, the most incidents belonged to: Outside Fires (45.4%), and Structure Fires (34.0%).