Waterford: Fire Incidents, Michigan (MI)
Where are fire incidents reported in Waterford, MI
Something went wrong! Please refresh the page.
| Fire incidents reported | |
|---|---|
| Sreet name | Count |
| DIXIE HWY | 196 |
| HIGHLAND RD | 142 |
| ELIZABETH LAKE RD | 114 |
| HIGHLAND ROAD | 108 |
| PONTIAC LAKE RD | 66 |
| WALTON BLVD | 56 |
| HURON ST | 54 |
| ELIZABETH LAKE ROAD | 52 |
| HATCHERY RD | 52 |
| WILLIAMS LAKE RD | 50 |
| CASS LAKE RD | 48 |
| COOLEY LAKE ROAD | 48 |
| PONTIAC LAKE ROAD | 44 |
| ALPHA PKY | 40 |
| TELEGRAPH RD | 40 |
| VILLAGE GREEN BLVD | 40 |
| WILLIAMSBURY DR | 40 |
| AIRPORT RD | 38 |
| GLENBROOKE | 36 |
| CASS ELIZABETH RD | 34 |
| COOLEY LAKE RD | 34 |
| WATKINS LAKE RD | 34 |
| CRESCENT LAKE RD | 30 |
| OAKLAND BLVD | 30 |
| CHEROKEE DR | 28 |
| SCOTT LAKE ROAD | 26 |
| HATCHERY ROAD | 24 |
| LASALLE AVE | 24 |
| LESLIE LN | 24 |
| SCOTT LAKE RD | 24 |
| Other | 547 |
2002 - 2018 National Fire Incident Reporting System (NFIRS) incidents
- Incident types reported to NFIRS in Waterford, MI
- 23,24766.2%Rescue & EMS
- 3,80310.8%Service Call
- 2,6727.6%Hazardous Condition
- 2,1236.0%Fire
- 2,0655.9%Good Intent Call
- 1,1883.4%False Alarm
- Fire incident types reported to NFIRS in Waterford, MI
- 1,06450.1%Structure Fires
- 56226.5%Outside Fires
- 39518.6%Mobile Property/Vehicle Fires
- 1024.8%Other
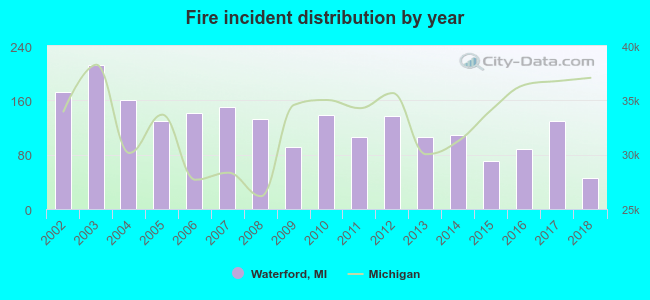 Based on the data from the years 2002 - 2018 the average number of fire incidents per year is 125. The highest number of fire incidents - 212 took place in 2003, and the least - 46 in 2018. The data has a decreasing trend.
The average number of yearly fire incidents per 10k residents in Waterford, MI compared to nearest cities:
(Note: Based on data for the last 3 years, including only cities with population 5,000 and above)
| Waterford: | 12.0 |
| Pontiac: | 46.2 |
| Auburn Hills: | 44.6 |
| Bloomfield Township: | 0.2 |
| Walled Lake: | 32.3 |
| Rochester Hills: | 16.9 |
| Birmingham: | 15.9 |
| Wixom: | 23.8 |
| Beverly Hills: | 23.9 |
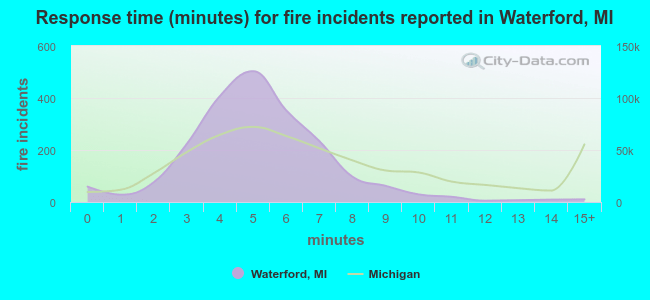 The median response time based on all reported fire incidents is 5 minutes. This is lower compared to the Michigan median value.
The median response time in Waterford, MI compared to nearest cities:
(Note: Based on data for all years, including only cities with at least 500 fire incidents)
| Waterford: | 5 minutes |
| Pontiac: | 5 minutes |
| Auburn Hills: | 7 minutes |
| Lake Orion: | 5 minutes |
| Rochester Hills: | 6 minutes |
| Wixom: | 9 minutes |
| Farmington Hills: | 8 minutes |
| Oxford: | 6 minutes |
| Troy: | 7 minutes |
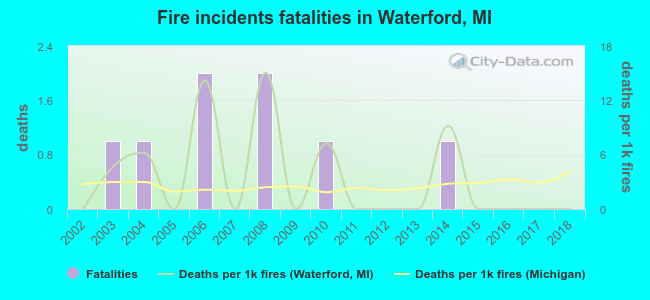 According to the reports from the years 2002 - 2018 the average number of fire-related yearly deaths is 0. The highest number of deaths - 2 took place in 2006, and the lowest - 0 in 2002. The data has a constant trend.
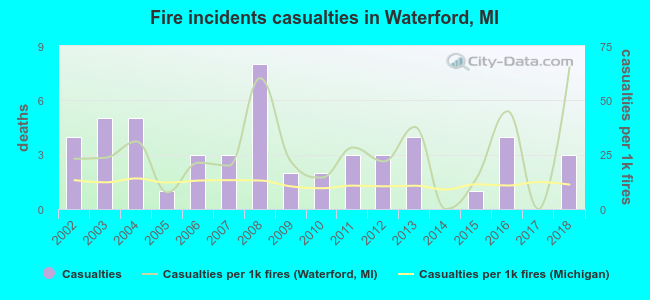 Based on the reports from the years 2002 - 2018 the average number of fire-related casualties per year is 3. The highest number of injuries - 8 took place in 2008, and the lowest - 0 in 2014. The data has a dropping trend.
The average number of injuries per 1,000 fire incidents is 26. This indicator was the highest - 65 in 2018, and the lowest 0 in 2014. The trend for injuries per 1,000 incidents is increasing. Compared to the state value the number of injuries per 1,000 incidents is much higher.
Based on the reports from the years 2002 - 2018 the average number of fire-related casualties per year is 3. The highest number of injuries - 8 took place in 2008, and the lowest - 0 in 2014. The data has a dropping trend.
The average number of injuries per 1,000 fire incidents is 26. This indicator was the highest - 65 in 2018, and the lowest 0 in 2014. The trend for injuries per 1,000 incidents is increasing. Compared to the state value the number of injuries per 1,000 incidents is much higher.Casualties per 1,000 incidents in Waterford, MI compared to nearest cities:
(Note: Based on data for all years, including only cities with at least 500 fire incidents)
| Waterford: | 24.0 |
| Pontiac: | 5.5 |
| Auburn Hills: | 11.1 |
| Lake Orion: | 4.6 |
| Rochester Hills: | 28.1 |
| Wixom: | 1.9 |
| Farmington Hills: | 48.2 |
| Oxford: | 9.5 |
| Troy: | 18.0 |
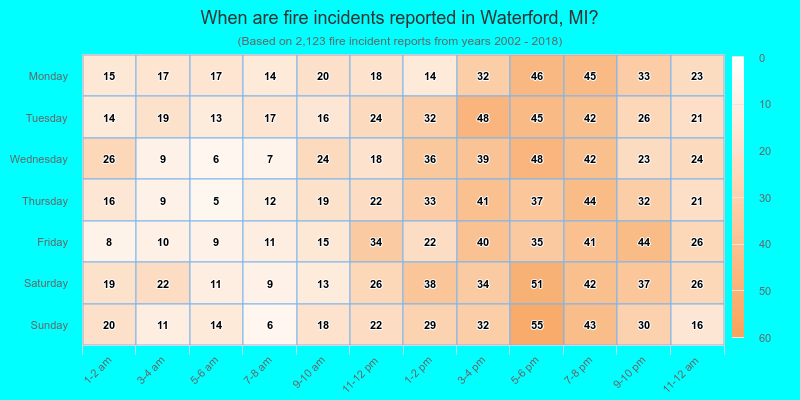
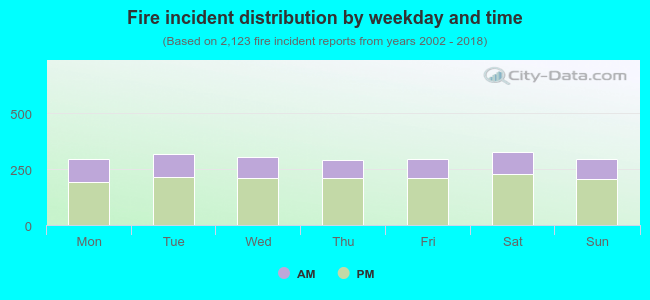 30.9% incidents where reported in the morning and 69.1% in the evening. The most fires (15.4%) took place on Saturday, and the least (13.7%) on Thursday.
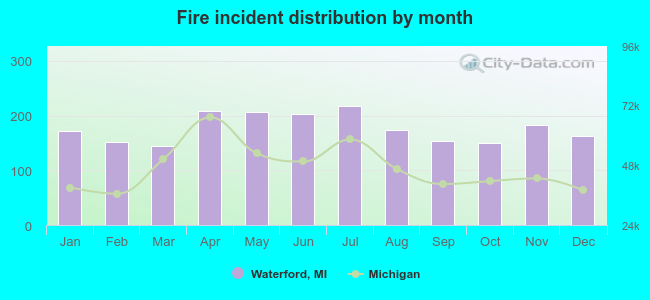 According to the 2,123 reports from years 2002 - 2018 most fires (10.3%) took place during July, and the least (6.8%) in March.
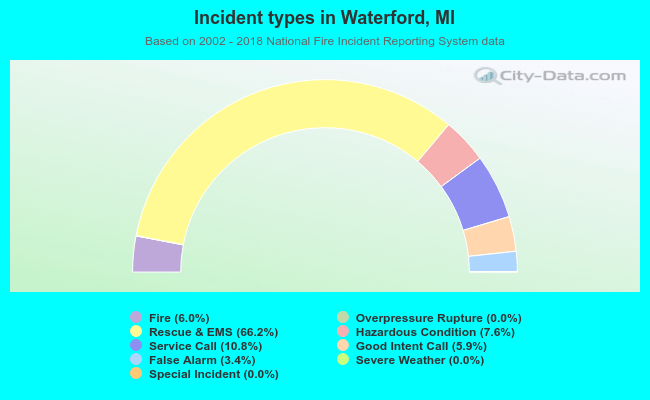 Out of all 35,123 cases reported during the years 2002 - 2018, the most belonged to the categories: Rescue & EMS (66.2%), Service Call (10.8%), and Hazardous Condition (7.6%).
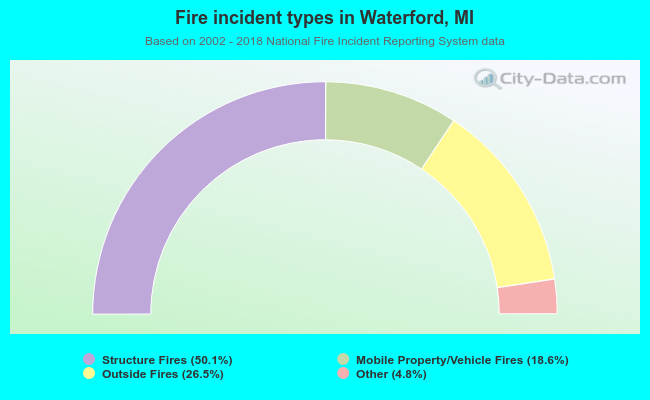 When looking into fire subcategories, the most reports belonged to: Structure Fires (50.1%), and Outside Fires (26.5%).