West Point: Fire Incidents, Mississippi (MS)
Where are fire incidents reported in West Point, MS
Something went wrong! Please refresh the page.
| Fire incidents reported | |
|---|---|
| Sreet name | Count |
| HWY 45 ALT | 56 |
| HWY 45 N. ALT. | 56 |
| HWY 45 N. | 50 |
| HWY 47 | 34 |
| HWY 45 S. ALT. | 30 |
| HWY 45 S. | 24 |
| OLD VINTON RD | 24 |
| HWY 50 W | 22 |
| HWY 50 W. | 22 |
| BARTON FERRY RD | 20 |
| LONE OAK ROAD | 20 |
| WAVERLY ROAD | 20 |
| HAZELWOOD RD | 18 |
| WHITE STATION RD | 18 |
| CHURCHILL RD | 16 |
| E. MAIN STREET | 16 |
| FIFTH STREET | 16 |
| GEORGE WALKER RD | 16 |
| LONE OAK DRIVE | 16 |
| DR SEARS RD | 14 |
| GRIFFIN ST. | 14 |
| HWY 45 ALT HWY | 14 |
| HWY 45 N ALT | 14 |
| LONE OAK PARK | 14 |
| MAIN ST | 14 |
| W. MAIN ST. | 14 |
| 45 ALT HWY | 12 |
| BUGG STREET | 12 |
| COMMERCE STREET | 12 |
| DARRACOTT RD | 12 |
| Other | 953 |
2002 - 2018 National Fire Incident Reporting System (NFIRS) incidents
- Incident types reported to NFIRS in West Point, MS
- 1,59356.7%Fire
- 35012.5%Hazardous Condition
- 30110.7%Rescue & EMS
- 2799.9%False Alarm
- 1384.9%Good Intent Call
- 1264.5%Service Call
- 110.4%Special Incident
- 80.3%Overpressure Rupture
- 30.1%Severe Weather
- Fire incident types reported to NFIRS in West Point, MS
- 49230.9%Other
- 44527.9%Outside Fires
- 34721.8%Mobile Property/Vehicle Fires
- 30919.4%Structure Fires
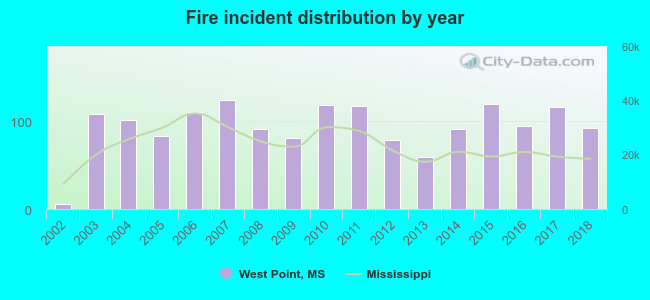 According to the data from the years 2002 - 2018 the average number of fire incidents per year is 94. The highest number of fire incidents - 124 took place in 2007, and the least - 6 in 2002. The data has a rising trend.
The average number of yearly fire incidents per 10k residents in West Point, MS compared to nearest cities:
(Note: Based on data for the last 3 years, including only cities with population 5,000 and above)
| West Point: | 91.0 |
| Starkville: | 64.8 |
| Columbus: | 55.2 |
| Aberdeen: | 182.3 |
| Amory: | 111.2 |
| Louisville: | 176.0 |
| Tupelo: | 81.8 |
| Pontotoc: | 260.7 |
| Saltillo: | 171.9 |
 The median response time based on all reported fire incidents is 4 minutes. This is lower compared to the state median value.
The median response time in West Point, MS compared to nearest cities:
(Note: Based on data for all years, including only cities with at least 500 fire incidents)
| West Point: | 4 minutes |
| Starkville: | 5 minutes |
| Columbus: | 5 minutes |
| Aberdeen: | 3 minutes |
| Amory: | 5 minutes |
| Okolona: | 7 minutes |
| Houston: | 7 minutes |
| Nettleton: | 9 minutes |
| Macon: | 6 minutes |
 Based on the data from the years 2002 - 2018 the average number of fire-related fatalities per year is 1. The highest number of deaths - 2 took place in 2014, and the lowest - 0 in 2002. The data has a growing trend.
 Based on the reports from the years 2002 - 2018 the average number of fire-related casualties per year is 0. The highest number of injuries - 1 took place in 2008, and the lowest - 0 in 2002. The data has a rising trend.
The average number of casualties per 1,000 fire incidents is 2. This indicator was the highest - 11 in 2008, and the lowest 0 in 2002. The trend for injuries per 1,000 incidents is growing. Compared to the state value the number of casualties per 1,000 fire incidents is lower.
Based on the reports from the years 2002 - 2018 the average number of fire-related casualties per year is 0. The highest number of injuries - 1 took place in 2008, and the lowest - 0 in 2002. The data has a rising trend.
The average number of casualties per 1,000 fire incidents is 2. This indicator was the highest - 11 in 2008, and the lowest 0 in 2002. The trend for injuries per 1,000 incidents is growing. Compared to the state value the number of casualties per 1,000 fire incidents is lower.
 31.1% incidents where reported in the morning and 68.9% in the evening. The most fires (15.0%) took place on Monday, and the least (13.2%) on Sunday.
 According to the 1,593 fires from years 2002 - 2018 most fires (11.6%) took place during January, and the least (6.7%) in April.
 Out of all 2,809 cases reported during the years 2002 - 2018, the most belonged to the categories: Fire (56.7%), Hazardous Condition (12.5%), and Rescue & EMS (10.7%).
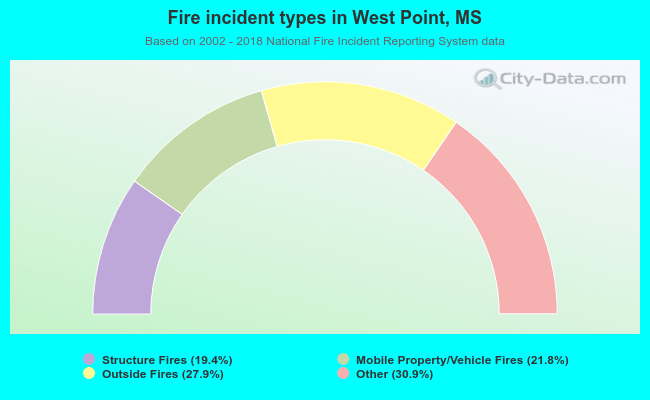 When looking into fire subcategories, the most reports belonged to: Other (30.9%), and Outside Fires (27.9%).