Bloomfield, NM (New Mexico) Houses and Residents
| Bloomfield: | $172,537 |
| New Mexico: | $243,100 |
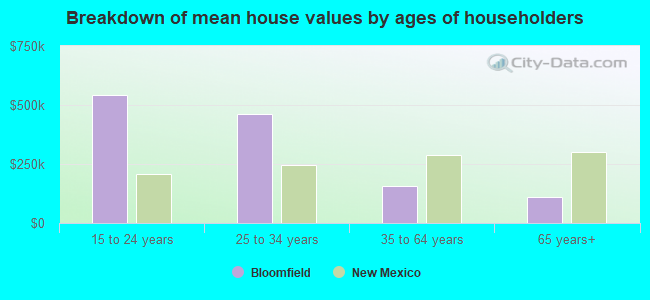
Mean price in 2022:
Detached houses: $261,783
Here: $261,783 State: $322,045 Townhouses or other attached units: $199,577
Here: $199,577 State: $284,053 Mobile homes: $189,727
Here: $189,727 State: $117,675
Total population: 7,638 (Urban population: 6,149 (all inside urban clusters), Rural population: 81 (all nonfarm))
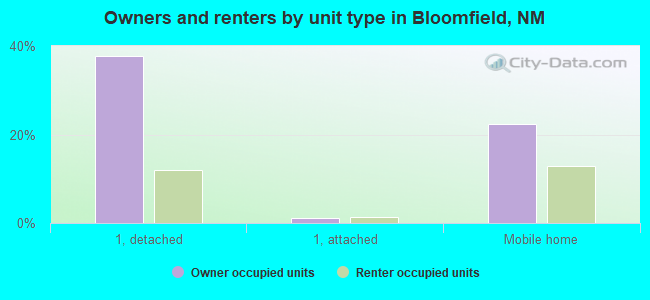
Houses: 2,910 (2,612 occupied: 1,870 owner occupied, 766 renter occupied)
| % of renters here: | 29% |
| State: | 29% |
Housing density: 581 houses/condos per square mile
Median price asked for vacant for-sale houses and condos in 2022: $209,354.
Median contract rent in 2022: $595 (lower quartile is $391, upper quartile is $658)
Median rent asked for vacant for-rent units in 2022: $1,116
Median gross rent in Bloomfield, NM in 2022: $814
Housing units in Bloomfield with a mortgage: 996 (0 second mortgage, 0 home equity loan, 0 both second mortgage and home equity loan)
Houses without a mortgage: 0
Median household income for houses/condos with a mortgage: $57,038
Median household income for apartments without a mortgage: $53,199
Median monthly housing costs: $784
Compare current foreclosures near Bloomfield, NM:
| Photo | Address | Area | Beds / Baths | Price | Details |
|---|---|---|---|---|---|

|
#1
Calle Del Rio
Bloomfield, NM 87413
|
1,646 sq. feet
|
2 baths 3 beds |
show details | |

|
#2
Road 47251
Bloomfield, NM 87413
|
- sq. feet
|
2 baths 4 beds |
show details | |

|
#3
N Moore St
Bloomfield, NM 87413
|
- sq. feet
|
2 baths 3 beds |
show details | |

|
#4
County Road 5063
Bloomfield, NM 87413
|
1,412 sq. feet
|
- baths - beds |
show details | |

|
#5
Us 64
Bloomfield, NM 87413
|
- sq. feet
|
- baths - beds |
show details | |

|
#6
Road 5063
Bloomfield, NM 87413
|
- sq. feet
|
- baths - beds |
show details | |

|
#7
N Church St
Bloomfield, NM 87413
|
- sq. feet
|
- baths - beds |
show details | |

|
#8
Road 47255
Bloomfield, NM 87413
|
- sq. feet
|
- baths - beds |
show details | |

|
#9
S 1st St
Bloomfield, NM 87413
|
- sq. feet
|
- baths - beds |
show details | |

|
#10
Road 5190
Bloomfield, NM 87413
|
- sq. feet
|
- baths - beds |
show details |
| Photo | Address | Area | Beds / Baths | Price | Details |
|---|---|---|---|---|---|

|
#11
W Joy Lynn St
Bloomfield, NM 87413
|
- sq. feet
|
- baths - beds |
show details | |

|
#12
N Light Plant Rd
Aztec, NM 87410
|
1,562 sq. feet
|
2 baths 3 beds |
show details | |

|
#13
County Road 3566
Flora Vista, NM 87415
|
1,512 sq. feet
|
2 baths 3 beds |
show details | |

|
#14
N Laguna Ave
Farmington, NM 87401
|
1,281 sq. feet
|
1 baths 3 beds |
show details | |

|
#15
Rd 4380
Blanco, NM 87412
|
- sq. feet
|
2 baths 3 beds |
show details | |

|
#16
El Paso Dr
Farmington, NM 87401
|
1,244 sq. feet
|
- baths - beds |
show details | |

|
#17
Piedra Vista Dr
Farmington, NM 87402
|
2,117 sq. feet
|
- baths - beds |
show details | |

|
#18
Brooke Pl
Farmington, NM 87401
|
1,077 sq. feet
|
- baths - beds |
show details | |

|
#19
Beckland Dr
Farmington, NM 87402
|
1,723 sq. feet
|
- baths - beds |
show details | |

|
#20
J F Scott Dr
Aztec, NM 87410
|
1,400 sq. feet
|
- baths - beds |
show details |
| Photo | Address | Area | Beds / Baths | Price | Details |
|---|---|---|---|---|---|

|
#21
Calla Lilly
Farmington, NM 87401
|
- sq. feet
|
- baths - beds |
show details | |

|
#22
Precept Way
Farmington, NM 87402
|
- sq. feet
|
- baths - beds |
show details | |

|
#23
W 24th St
Farmington, NM 87401
|
- sq. feet
|
- baths - beds |
show details | |

|
#24
Road 5295
Farmington, NM 87401
|
- sq. feet
|
- baths - beds |
show details | |

|
#25
J F Scott Dr
Aztec, NM 87410
|
- sq. feet
|
- baths - beds |
show details | |

|
#26
El Paso Dr
Farmington, NM 87401
|
- sq. feet
|
- baths - beds |
show details | |

|
#27
Road 3320
Aztec, NM 87410
|
- sq. feet
|
- baths - beds |
show details | |

|
#28
Road 5466
Farmington, NM 87401
|
- sq. feet
|
- baths - beds |
show details | |

|
#29
Chilton Ct
Farmington, NM 87401
|
- sq. feet
|
- baths - beds |
show details | |

|
#30
Kiva Ave
Aztec, NM 87410
|
- sq. feet
|
- baths - beds |
show details |
| Photo | Address | Area | Beds / Baths | Price | Details |
|---|---|---|---|---|---|

|
#31
E 30th Pl
Farmington, NM 87402
|
- sq. feet
|
- baths - beds |
show details | |

|
#32
E Main St, Ste 106 Pmb 158
Farmington, NM 87402
|
- sq. feet
|
- baths - beds |
show details | |

|
#33
Ostrich St
Farmington, NM 87401
|
- sq. feet
|
- baths - beds |
show details | |

|
#34
Mountain View Dr
Aztec, NM 87410
|
- sq. feet
|
- baths - beds |
show details | |

|
#35
Crestridge Dr
Farmington, NM 87401
|
- sq. feet
|
- baths - beds |
show details | |

|
#36
Crescent Ave
Farmington, NM 87401
|
- sq. feet
|
- baths - beds |
show details | |

|
#37
Crestridge Dr
Farmington, NM 87401
|
- sq. feet
|
- baths - beds |
show details | |

|
#38
Road 3088
Aztec, NM 87410
|
- sq. feet
|
- baths - beds |
show details | |

|
#39
N Mesa Verde Ave
Farmington, NM 87401
|
- sq. feet
|
- baths - beds |
show details | |

|
#40
N Monterey Ave
Farmington, NM 87401
|
- sq. feet
|
- baths - beds |
show details |
| Photo | Address | Area | Beds / Baths | Price | Details |
|---|---|---|---|---|---|

|
#41
W 31st St
Farmington, NM 87401
|
- sq. feet
|
- baths - beds |
show details | |

|
#42
Northwood Dr
Farmington, NM 87401
|
- sq. feet
|
- baths - beds |
show details | |

|
#43
Lynwood Dr
Farmington, NM 87401
|
- sq. feet
|
- baths - beds |
show details | |

|
#44
W 27th St
Farmington, NM 87401
|
- sq. feet
|
- baths - beds |
show details | |

|
#45
N Western Ave
Farmington, NM 87401
|
- sq. feet
|
- baths - beds |
show details | |

|
#46
W 31st St
Farmington, NM 87401
|
- sq. feet
|
- baths - beds |
show details | |

|
#47
Ocio St
Farmington, NM 87401
|
- sq. feet
|
- baths - beds |
show details | |

|
#48
W Lonewolf Dr
Farmington, NM 87401
|
- sq. feet
|
- baths - beds |
show details | |

|
#49
La Sierra Pl
Farmington, NM 87401
|
- sq. feet
|
- baths - beds |
show details | |

|
Check over 1 million property listings on Foreclosure.com!
|
browse all offers | |||

Latest news about housing in Bloomfield, NM collected exclusively by city-data.com from local newspapers, TV, and radio stations

 | Dome Homes- are there communities? (4 replies) |
| Off the Grid, Homesteading (269 replies) |
| Farmington as a retirement destination (10 replies) |
| What's your favorite book, fiction or non-fiction, set in ABQ or NM? (44 replies) |
| Rte 550 from Bernalillo to Farmington (8 replies) |
| Good elementary schools/housing in Farmington (0 replies) |

Median year apartment built: 1977
Household type by relationship:
Households: 7,345- Male householders: 1,187 (273 living alone), Female householders: 1,388 (397 living alone)
978 spouses (960 opposite-sex spouses), 202 unmarried partners, (202 opposite-sex unmarried partners), 2,195 children (2,066 natural, 26 adopted, 102 stepchildren), 480 grandchildren, 200 brothers or sisters, 89 parents, 0 foster children, 250 other relatives, 297 non-relatives
- In group quarters: 74
Size of family households: 711 2-persons, 462 3-persons, 212 4-persons, 227 5-persons, 90 6-persons, 38 7-or-more-persons.
Size of nonfamily households: 795 1-person, 66 2-persons, 56 3-persons.
1,217 married couples with children.
601 single-parent households (49 men, 552 women).
77.9% of residents of Bloomfield speak English at home.
16.0% of residents speak Spanish at home (36% speak English very well, 59% speak English well, 3% speak English not well, 2% don't speak English at all).
7.8% of residents speak other language at home (70% speak English very well, 22% speak English well, 8% speak English not well).
Foreign born population: 175 (2.4%)
(20.6% of them are naturalized citizens)
| Here: | 5.2 |
| State: | 5.9 |
| Here: | 4.3 |
| State: | 4.2 |
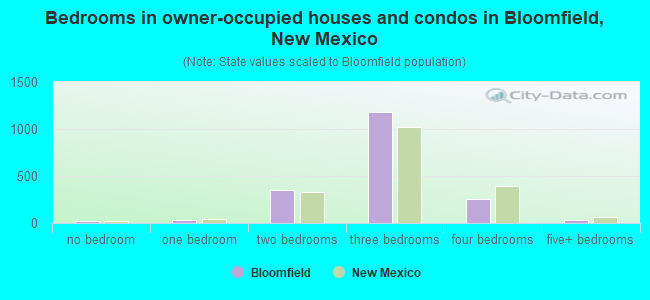
- Bedrooms in owner-occupied houses and condos in Bloomfield, New Mexico
- 16no bedroom
- 271 bedroom
- 3502 bedrooms
- 1,1863 bedrooms
- 2574 bedrooms
- 335+ bedrooms
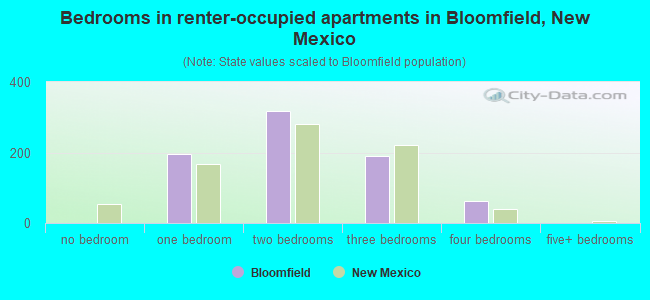
- Bedrooms in renter-occupied apartments in Bloomfield, New Mexico
- 0no bedroom
- 1961 bedroom
- 3172 bedrooms
- 1903 bedrooms
- 634 bedrooms
- 05+ bedrooms
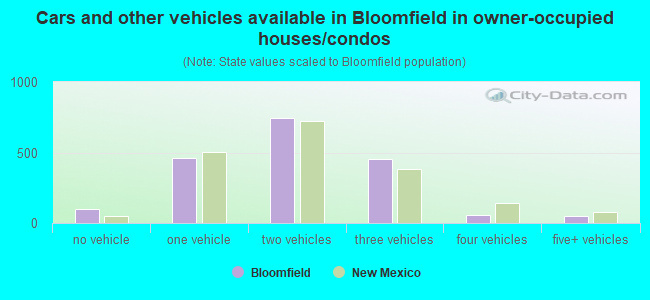
- Cars and other vehicles available in Bloomfield in owner-occupied houses/condos
- 97no vehicle
- 4611 vehicle
- 7482 vehicles
- 4573 vehicles
- 564 vehicles
- 515+ vehicles
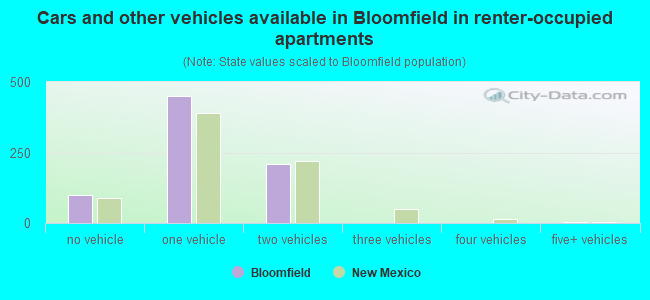
- Cars and other vehicles available in Bloomfield in renter-occupied apartments
- 98no vehicle
- 4521 vehicle
- 2102 vehicles
- 03 vehicles
- 04 vehicles
- 55+ vehicles
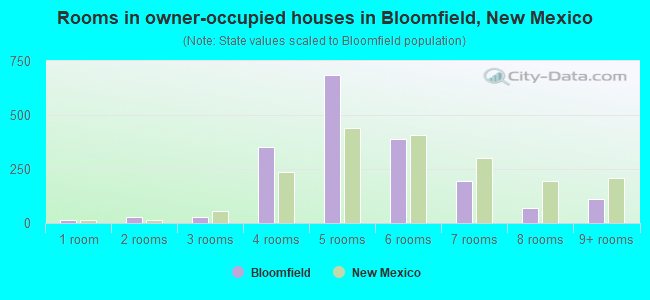
- Rooms in owner-occupied houses in Bloomfield, New Mexico
- 161 room
- 272 rooms
- 283 rooms
- 3514 rooms
- 6865 rooms
- 3876 rooms
- 1937 rooms
- 708 rooms
- 1119+ rooms
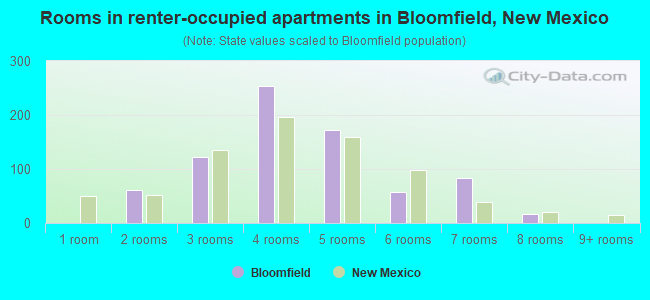
- Rooms in renter-occupied apartments in Bloomfield, New Mexico
- 01 room
- 622 rooms
- 1233 rooms
- 2534 rooms
- 1725 rooms
- 576 rooms
- 837 rooms
- 168 rooms
- 09+ rooms
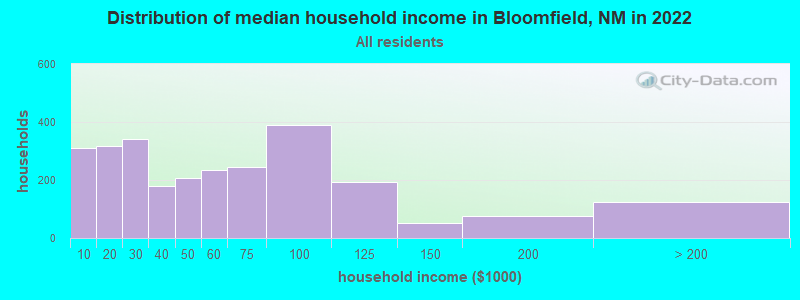
Bloomfield, NM household income distribution

- 311Less than $10,000
- 316$10,000 to $19,999
- 343$20,000 to $29,999
- 178$30,000 to $39,999
- 207$40,000 to $49,999
- 236$50,000 to $59,999
- 244$60,000 to $74,999
- 389$75,000 to $99,999
- 194$100,000 to $124,999
- 52$125,000 to $149,999
- 76$150,000 to $199,999
- 124$200,000 or more
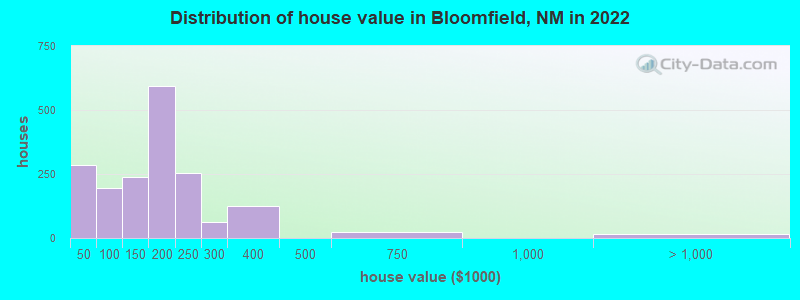
Home value of owner - occupied houses in 2022 in Bloomfield, NM
-
- 141Less than $10,000
- 28$10,000 to $14,999
- 116$30,000 to $34,999
- 28$50,000 to $59,999
- 43$60,000 to $69,999
- 66$70,000 to $79,999
- 52$80,000 to $89,999
- 5$90,000 to $99,999
- 166$100,000 to $124,999
- 73$125,000 to $149,999
- 493$150,000 to $174,999
- 100$175,000 to $199,999
- 255$200,000 to $249,999
- 62$250,000 to $299,999
- 124$300,000 to $399,999
- 22$500,000 to $749,999
- 14$2,000,000 or more
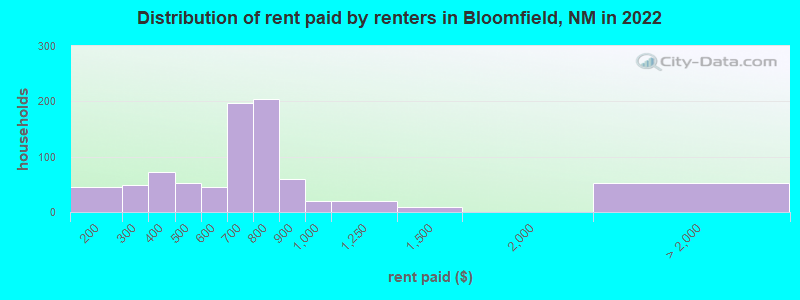
Rent paid by renters in 2022 in Bloomfield, NM
-
- 44$100 to $149
- 47$250 to $299
- 72$350 to $399
- 52$400 to $449
- 46$550 to $599
- 180$600 to $649
- 16$650 to $699
- 96$700 to $749
- 106$750 to $799
- 60$800 to $899
- 18$900 to $999
- 19$1,000 to $1,249
- 9$1,250 to $1,499
- 51No cash rent
Percentage of workers working in this county: 96.1%
Number of people working at home: 75 (2.4% of all workers)
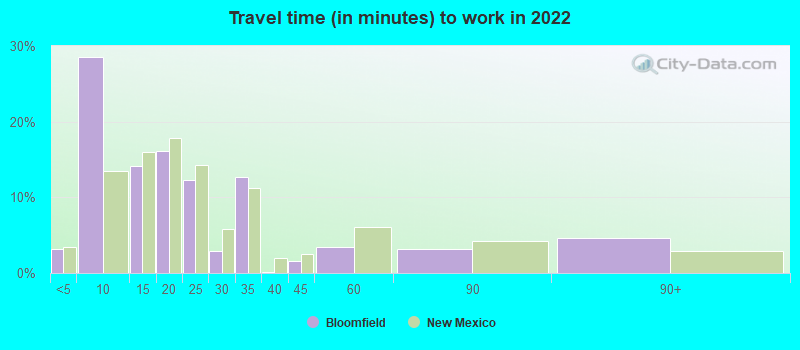
Travel time to work (commute)
- Less than 5 minutes: 91
- 5 to 9 minutes: 458
- 10 to 14 minutes: 288
- 15 to 19 minutes: 459
- 20 to 24 minutes: 264
- 25 to 29 minutes: 341
- 30 to 34 minutes: 712
- 35 to 39 minutes: 36
- 40 to 44 minutes: 14
- 45 to 59 minutes: 136
- 60 to 89 minutes: 99
- 90 or more minutes: 245
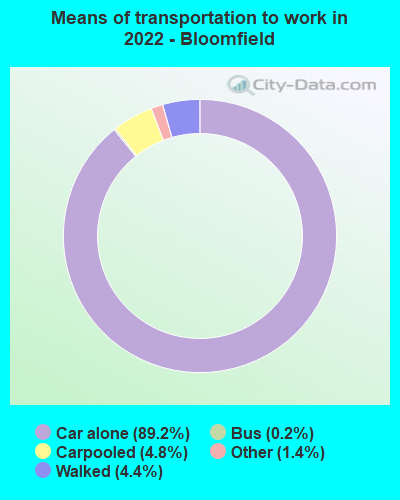
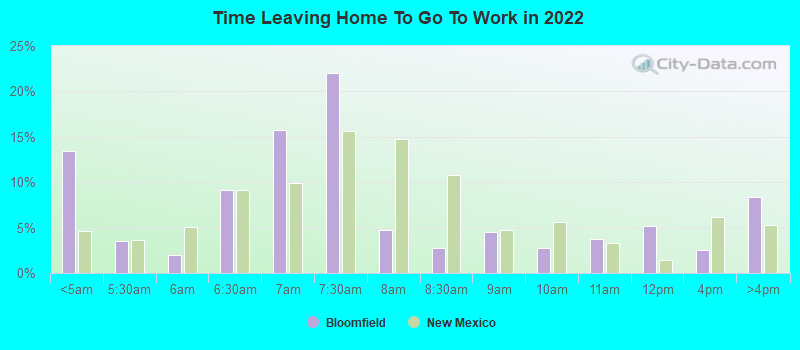
Means of transportation to work:
- Drove a car alone: 2,050 (83.6%)
- Carpooled: 119 (4.9%)
- Bus: 4 (0.2%)
- Taxi: 35 (1.4%)
- Walked: 115 (4.7%)
- Worked at home: 75 (3.1%)
- Unemployment by race in 2022
- Unemployment rate for White non-Hispanic residents
- 3.2%Males
- 0.8%Females
- Unemployment rate for other race residents
- 14.9%Males
- Unemployment rate for Hispanic or Latino residents
- 7.9%Males
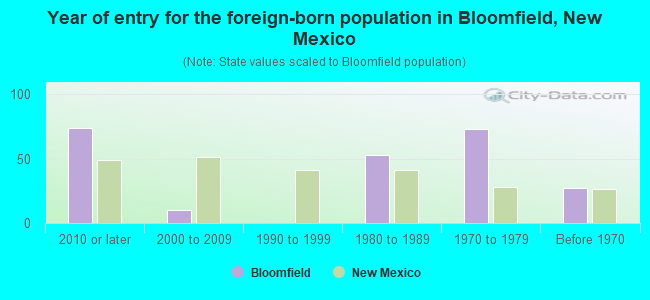
- Year of entry for the foreign-born population in Bloomfield, New Mexico
- 742010 or later
- 102000 to 2009
- 01990 to 1999
- 531980 to 1989
- 731970 to 1979
- 27Before 1970
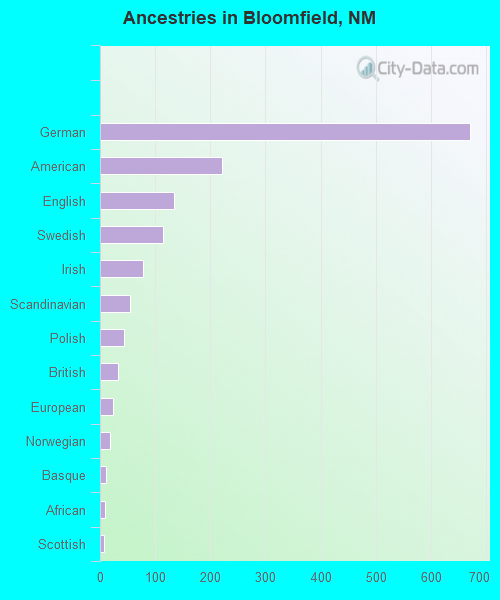
First ancestries reported:
- German: 672 (14.1%)
- American: 221 (4.6%)
- English: 135 (2.8%)
- Swedish: 115 (2.4%)
- Irish: 78 (1.6%)
- Scandinavian: 54 (1.1%)
- Polish: 44 (0.9%)
- British: 32 (0.7%)
- European: 23 (0.5%)
- Norwegian: 18 (0.4%)
- Basque: 10 (0.2%)
- African: 9 (0.2%)
- Scottish: 7 (0.1%)
- Scotch-Irish: 6 (0.1%)
Most common places of birth for foreign-born residents (%):
| Bloomfield: | 93.9% (138) |
| New Mexico: | 66.5% (129,316) |
| Bloomfield: | 2.7% (4) |
| New Mexico: | 0.0% (20) |
Place of birth for U.S.-born residents:
- This state: 4,498
- Other state: 2,671
- Northeast: 33
- Midwest: 256
- South: 256
- West: 2,209
91.4% of Bloomfield residents lived in the same house 1 years ago.
Out of people who lived in different houses, 35.4% lived in this county.
Out of people who lived in different counties, 68.2% lived in New Mexico.
| Bloomfield: | 91.4% |
| State average: | 88.2% |
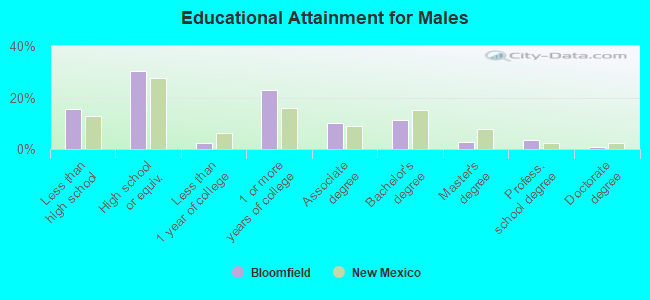
Education attainment for males 25 years and older:
- No schooling: 25
- Nursery to 4th grade: 15
- 5th and 6th grade: 0
- 7th and 8th grade: 112
- 9th grade: 88
- 10th grade: 48
- 11th grade: 15
- 12th grade, no diploma: 54
- High school graduate (or equivalency): 685
- Less than 1 year of college: 53
- Some college more than 1 year, no degree: 521
- Associate degree: 227
- Bachelor's degree: 260
- Master's degree: 66
- Professional school degree: 82
- Doctorate degree: 20
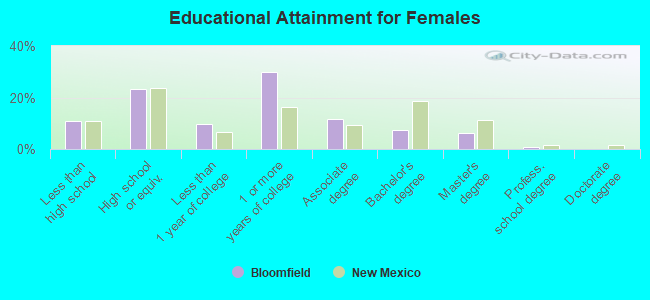
Education attainment for females 25 years and older:
- No schooling: 5
- Nursery to 4th grade: 8
- 5th and 6th grade: 0
- 7th and 8th grade: 23
- 9th grade: 15
- 10th grade: 22
- 11th grade: 61
- 12th grade, no diploma: 107
- High school graduate (or equivalency): 522
- Less than 1 year of college: 220
- Some college more than 1 year, no degree: 672
- Associate degree: 264
- Bachelor's degree: 162
- Master's degree: 135
- Professional school degree: 20
- Doctorate degree: 0


Housing units in structures:
- One, detached: 1,356
- One, attached: 48
- Two: 80
- 3 or 4: 145
- 5 to 9: 119
- 10 to 19: 11
- 20 to 49: 5
- 50 or more: 17
- Mobile homes: 1,100
- Boats, RVs, vans, etc.: 27
Median worth of mobile homes: $100,392
Housing units lacking complete kitchen facilities in 2022: 4.5%
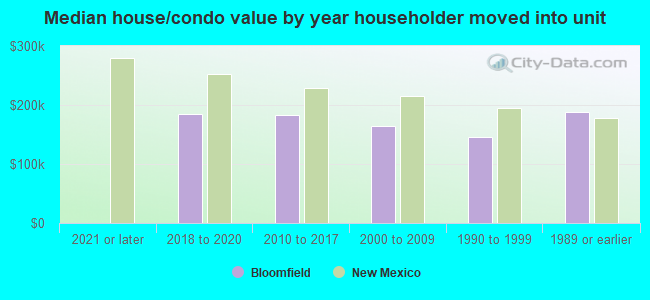
House/condo owner moved in on average 18 years ago
Renter moved in on average 2 years ago
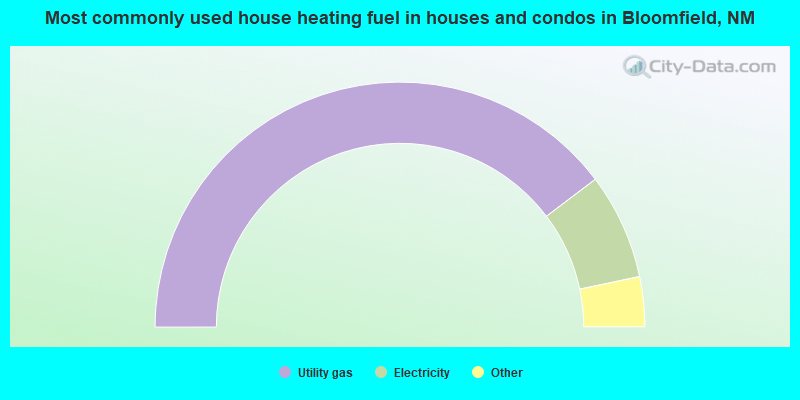
- 79.5%Utility gas
- 14.0%Electricity
- 3.4%Wood
- 2.8%Bottled, tank, or LP gas
- 0.4%Other fuel
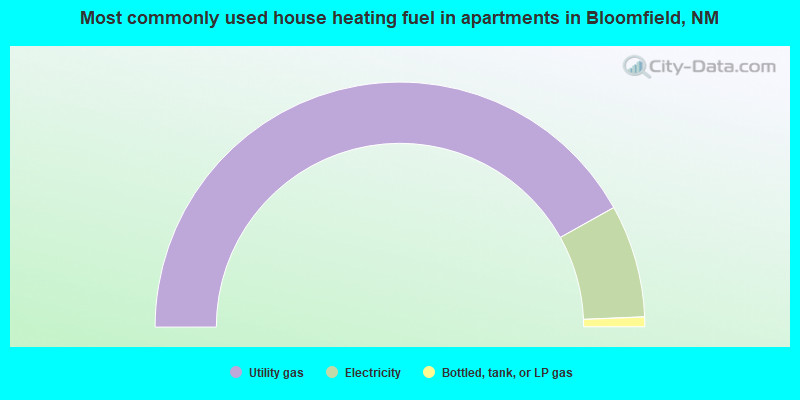
- 83.8%Utility gas
- 14.9%Electricity
- 1.3%Bottled, tank, or LP gas
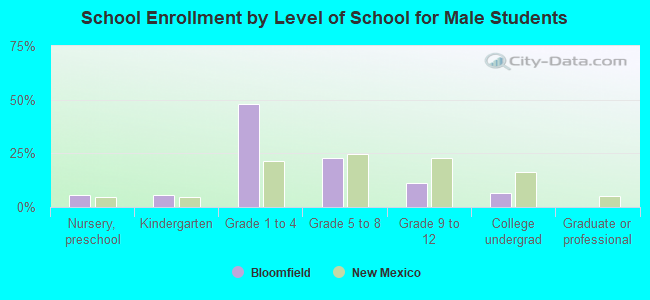
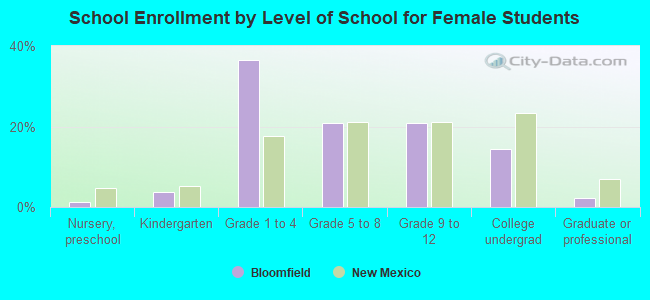
Private vs. public school enrollment:
| Here: | 15.5% |
| New Mexico: | 10.2% |
| Here: | 0.7% |
| New Mexico: | 10.0% |
| Here: | 0.0% |
| New Mexico: | 12.3% |