DeSoto, TX (Texas) Houses and Residents
| DeSoto: | $303,697 |
| Texas: | $275,400 |
Total population: 51,934 (Urban population: 37,485, Rural population: 138 (all nonfarm))
Houses: 22,071 (20,829 occupied: 14,790 owner occupied, 6,305 renter occupied)
| % of renters here: | 30% |
| State: | 38% |
Housing density: 1,023 houses/condos per square mile
Median price asked for vacant for-sale houses and condos in 2022: $274,062.
Median contract rent in 2022: $1,294 (lower quartile is $1,055, upper quartile is $1,739)
Median rent asked for vacant for-rent units in 2022: $1,324
Median gross rent in DeSoto, TX in 2022: $1,473
Housing units in DeSoto with a mortgage: 9,756 (453 second mortgage, 0 home equity loan, 265 both second mortgage and home equity loan)
Houses without a mortgage: 65
Median household income for houses/condos with a mortgage: $105,882
Median household income for apartments without a mortgage: $92,177
Median monthly housing costs: $1,588
Compare current foreclosures in DeSoto, TX:
| Photo | Address | Area | Beds / Baths | Price | Details |
|---|---|---|---|---|---|

|
#1
Carriage Creek Dr
Desoto, TX 75115
|
4,333 sq. feet
|
4 baths 5 beds |
show details | |

|
#2
Dogwood Trl
Desoto, TX 75115
|
1,656 sq. feet
|
2 baths 3 beds |
show details | |

|
#3
Peggs St
Desoto, TX 75115
|
6,656 sq. feet
|
6 baths 8 beds |
show details | |

|
#4
Bayberry Ln
Desoto, TX 75115
|
1,804 sq. feet
|
2 baths 3 beds |
show details | |

|
#5
Buffalo Creek Dr
Desoto, TX 75115
|
2,701 sq. feet
|
3 baths 4 beds |
show details | |

|
#6
Candelilla Dr
Desoto, TX 75115
|
3,076 sq. feet
|
3 baths 4 beds |
show details | |

|
#7
Balsam Grove Ln
Desoto, TX 75115
|
2,217 sq. feet
|
2 baths 4 beds |
show details | |

|
#8
Clear Springs Dr
Desoto, TX 75115
|
2,454 sq. feet
|
2 baths 3 beds |
show details | |

|
#9
Lexington Ln
Desoto, TX 75115
|
2,534 sq. feet
|
3 baths 5 beds |
show details | |

|
#10
Carriage Creek Dr
Desoto, TX 75115
|
3,020 sq. feet
|
2 baths 5 beds |
show details |
| Photo | Address | Area | Beds / Baths | Price | Details |
|---|---|---|---|---|---|

|
#11
Lakeside Dr
Desoto, TX 75115
|
3,764 sq. feet
|
3 baths 5 beds |
show details | |

|
#12
Hillside Ln
Desoto, TX 75115
|
1,678 sq. feet
|
2 baths 3 beds |
show details | |

|
#13
Ashford Dr
Desoto, TX 75115
|
3,709 sq. feet
|
3 baths 4 beds |
show details | |

|
#14
Rio Bravo Dr
Desoto, TX 75115
|
1,919 sq. feet
|
2 baths 3 beds |
show details | |

|
#15
Rickey Canyon Ave
Desoto, TX 75115
|
2,872 sq. feet
|
2 baths 4 beds |
show details | |

|
#16
Rising Ridge Dr
Desoto, TX 75115
|
2,026 sq. feet
|
2 baths 3 beds |
show details | |

|
#17
Hollow Crest Dr
Desoto, TX 75115
|
3,345 sq. feet
|
3 baths 4 beds |
show details | |

|
#18
Rio Vista Dr
Desoto, TX 75115
|
1,856 sq. feet
|
2 baths 4 beds |
show details | |

|
#19
Mulberry Ln
Desoto, TX 75115
|
3,128 sq. feet
|
3 baths 4 beds |
show details | |

|
#20
Clear Springs Dr
Desoto, TX 75115
|
2,693 sq. feet
|
3 baths 3 beds |
show details |
| Photo | Address | Area | Beds / Baths | Price | Details |
|---|---|---|---|---|---|

|
#21
Ray Ave
Desoto, TX 75115
|
2,024 sq. feet
|
2 baths 3 beds |
show details | |

|
#22
Charles St
Desoto, TX 75115
|
2,698 sq. feet
|
4 baths 4 beds |
show details | |

|
#23
Carriage Creek Dr
Desoto, TX 75115
|
2,759 sq. feet
|
2 baths 3 beds |
show details | |

|
#24
Mulberry Ln
Desoto, TX 75115
|
3,404 sq. feet
|
2 baths 3 beds |
show details | |

|
#25
W Jay Ct
Desoto, TX 75115
|
1,419 sq. feet
|
2 baths 3 beds |
show details | |

|
#26
Robin Meadows
Desoto, TX 75115
|
2,155 sq. feet
|
2 baths 3 beds |
show details | |

|
#27
Buckingham Pl
Desoto, TX 75115
|
1,781 sq. feet
|
2 baths 3 beds |
show details | |

|
#28
Twin Creek Dr
Desoto, TX 75115
|
2,256 sq. feet
|
2 baths 3 beds |
show details | |

|
#29
Laramie Ln
Desoto, TX 75115
|
1,819 sq. feet
|
2 baths 3 beds |
show details | |

|
#30
Wildwood Dr
Desoto, TX 75115
|
1,851 sq. feet
|
2 baths 3 beds |
show details |
| Photo | Address | Area | Beds / Baths | Price | Details |
|---|---|---|---|---|---|

|
#31
Streamside Dr
Desoto, TX 75115
|
1,423 sq. feet
|
2 baths 3 beds |
show details | |

|
#32
Pheasant Ln
Desoto, TX 75115
|
1,725 sq. feet
|
2 baths 3 beds |
show details | |

|
#33
Meadowcrest Dr
Desoto, TX 75115
|
1,865 sq. feet
|
2 baths 3 beds |
show details | |

|
#34
Woodbrook Dr
Desoto, TX 75115
|
2,617 sq. feet
|
2 baths 3 beds |
show details | |

|
#35
Keysville Ave
Desoto, TX 75115
|
1,464 sq. feet
|
1 baths 3 beds |
show details | |

|
#36
Charles St
Desoto, TX 75115
|
2,102 sq. feet
|
2 baths 4 beds |
show details | |

|
#37
Kensington Dr
Desoto, TX 75115
|
2,506 sq. feet
|
2 baths 3 beds |
show details | |

|
#38
Echobrook Pl
Desoto, TX 75115
|
2,580 sq. feet
|
2 baths 3 beds |
show details | |

|
#39
Barrington Dr
Desoto, TX 75115
|
2,325 sq. feet
|
2 baths 4 beds |
show details | |

|
#40
Canyon Pl
Desoto, TX 75115
|
2,736 sq. feet
|
2 baths 4 beds |
show details |
| Photo | Address | Area | Beds / Baths | Price | Details |
|---|---|---|---|---|---|

|
#41
Edgewood Dr
Desoto, TX 75115
|
2,887 sq. feet
|
3 baths 4 beds |
show details | |

|
#42
Old Hickory Trl
Desoto, TX 75115
|
1,128 sq. feet
|
1 baths 3 beds |
show details | |

|
#43
Twin Creek Dr
Desoto, TX 75115
|
2,256 sq. feet
|
2 baths 3 beds |
show details | |

|
#44
Candellia Dr
Desoto, TX 75115
|
3,076 sq. feet
|
3 baths 4 beds |
show details | |

|
#45
Thistlewood Dr
Desoto, TX 75115
|
2,178 sq. feet
|
2 baths 3 beds |
show details | |

|
#46
Wentwood Dr
Desoto, TX 75115
|
1,785 sq. feet
|
2 baths 3 beds |
show details | |

|
#47
Regalwood Dr
Desoto, TX 75115
|
1,770 sq. feet
|
2 baths 3 beds |
show details | |

|
#48
Edmonds Way
Desoto, TX 75115
|
1,784 sq. feet
|
2 baths 4 beds |
show details | |

|
#49
The Meadows Pkwy
Desoto, TX 75115
|
2,083 sq. feet
|
2 baths 4 beds |
show details | |

|
Check over 1 million property listings on Foreclosure.com!
|
browse all offers | |||

Latest news about housing in DeSoto, TX collected exclusively by city-data.com from local newspapers, TV, and radio stations

 | Carrollton/West Plano Custom Home (98 replies) |
| Affordable Housing : Winds of change in Plano (45 replies) |
| Is DFW becoming less affordable? (369 replies) |
| Tom Thumb seeks $5.8 million in incentives from Dallas to build at RedBird (20 replies) |
| Dallas Suburb Stereotypes (115 replies) |
| Possible relocation to Mesquite (47 replies) |

Median year apartment built: 1996
Household type by relationship:
Households: 55,813- Male householders: 7,380 (2,050 living alone), Female householders: 12,971 (4,401 living alone)
8,714 spouses (8,692 opposite-sex spouses), 393 unmarried partners, (349 opposite-sex unmarried partners), 18,185 children (17,169 natural, 457 adopted, 558 stepchildren), 3,073 grandchildren, 759 brothers or sisters, 946 parents, 161 foster children, 1,581 other relatives, 1,069 non-relatives
- In group quarters: 575
Size of family households: 5,299 2-persons, 3,478 3-persons, 2,758 4-persons, 1,160 5-persons, 516 6-persons, 332 7-or-more-persons.
Size of nonfamily households: 6,896 1-person, 412 2-persons, 117 3-persons, 74 4-persons.
6,310 married couples with children.
3,110 single-parent households (494 men, 2,616 women).
86.1% of residents of DeSoto speak English at home.
11.8% of residents speak Spanish at home (61% speak English very well, 24% speak English well, 14% speak English not well, 1% don't speak English at all).
0.6% of residents speak other Indo-European language at home (92% speak English very well, 4% speak English well, 3% speak English not well).
1.0% of residents speak Asian or Pacific Island language at home (49% speak English very well, 14% speak English well, 34% speak English not well, 4% don't speak English at all).
1.0% of residents speak other language at home (99% speak English very well, 1% speak English well).
Foreign born population: 3,945 (7.1%)
(53.7% of them are naturalized citizens)
| Here: | 7.4 |
| State: | 6.3 |
| Here: | 4.1 |
| State: | 4.0 |

- Bedrooms in owner-occupied houses and condos in DeSoto, Texas
- 35no bedroom
- 511 bedroom
- 5182 bedrooms
- 6,5553 bedrooms
- 6,0574 bedrooms
- 1,5755+ bedrooms

- Bedrooms in renter-occupied apartments in DeSoto, Texas
- 518no bedroom
- 1,8811 bedroom
- 1,8092 bedrooms
- 1,1943 bedrooms
- 6004 bedrooms
- 3045+ bedrooms

- Cars and other vehicles available in DeSoto in owner-occupied houses/condos
- 152no vehicle
- 3,2301 vehicle
- 5,9812 vehicles
- 3,3473 vehicles
- 1,4674 vehicles
- 6145+ vehicles

- Cars and other vehicles available in DeSoto in renter-occupied apartments
- 576no vehicle
- 3,5541 vehicle
- 1,5252 vehicles
- 4803 vehicles
- 1154 vehicles
- 565+ vehicles

- Rooms in owner-occupied houses in DeSoto, Texas
- 351 room
- 02 rooms
- 753 rooms
- 4394 rooms
- 1,9095 rooms
- 2,5466 rooms
- 2,5737 rooms
- 2,4638 rooms
- 4,7529+ rooms

- Rooms in renter-occupied apartments in DeSoto, Texas
- 5061 room
- 1642 rooms
- 1,4573 rooms
- 1,7224 rooms
- 7485 rooms
- 3246 rooms
- 4907 rooms
- 4278 rooms
- 4699+ rooms


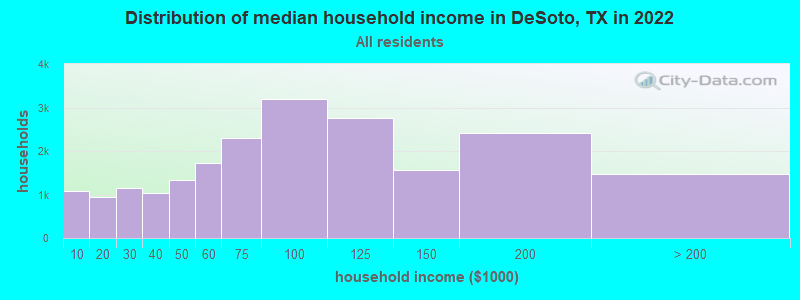
DeSoto, TX household income distribution

- 1,075Less than $10,000
- 936$10,000 to $19,999
- 1,156$20,000 to $29,999
- 1,038$30,000 to $39,999
- 1,324$40,000 to $49,999
- 1,735$50,000 to $59,999
- 2,307$60,000 to $74,999
- 3,195$75,000 to $99,999
- 2,756$100,000 to $124,999
- 1,552$125,000 to $149,999
- 2,409$150,000 to $199,999
- 1,479$200,000 or more
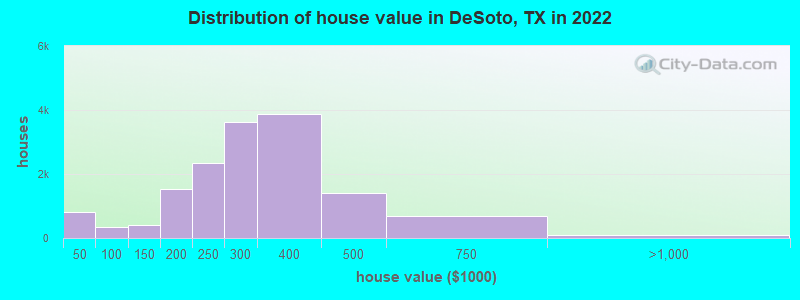
Home value of owner - occupied houses in 2022 in DeSoto, TX
-
- 219Less than $10,000
- 54$10,000 to $14,999
- 27$15,000 to $19,999
- 89$20,000 to $24,999
- 197$25,000 to $29,999
- 187$30,000 to $34,999
- 34$35,000 to $39,999
- 15$40,000 to $49,999
- 58$50,000 to $59,999
- 21$60,000 to $69,999
- 74$70,000 to $79,999
- 21$80,000 to $89,999
- 142$90,000 to $99,999
- 192$100,000 to $124,999
- 206$125,000 to $149,999
- 572$150,000 to $174,999
- 968$175,000 to $199,999
- 2,341$200,000 to $249,999
- 3,637$250,000 to $299,999
- 3,868$300,000 to $399,999
- 1,392$400,000 to $499,999
- 675$500,000 to $749,999
- 89$750,000 to $999,999
Rent paid by renters in 2022 in DeSoto, TX
-
- 44Less than $100
- 97$100 to $149
- 85$150 to $199
- 84$200 to $249
- 60$250 to $299
- 49$300 to $349
- 63$400 to $449
- 46$450 to $499
- 65$500 to $549
- 5$550 to $599
- 12$600 to $649
- 52$750 to $799
- 189$800 to $899
- 510$900 to $999
- 1,750$1,000 to $1,249
- 1,098$1,250 to $1,499
- 1,588$1,500 to $1,999
- 453$2,000 to $2,499
- 138$2,500 to $2,999
- 37$3,000 to $3,499
- 44$3,500 or more
- 90No cash rent

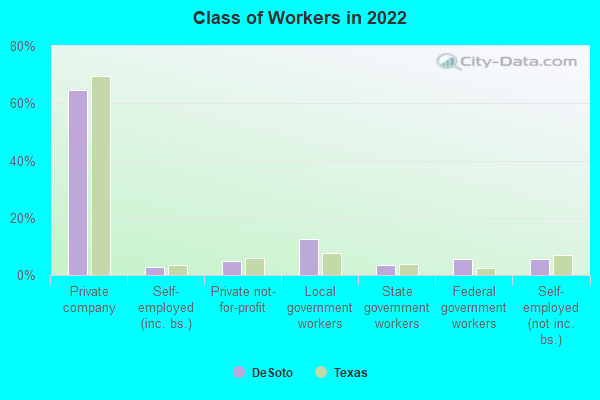
Percentage of workers working in this county: 84.4%
Number of people working at home: 5,021 (17.8% of all workers)
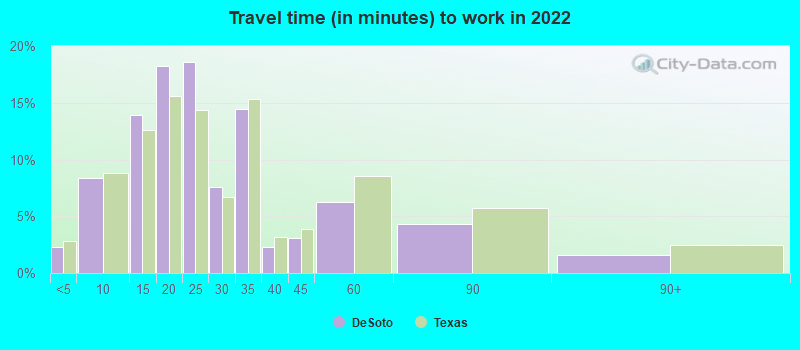
Travel time to work (commute)
- Less than 5 minutes: 497
- 5 to 9 minutes: 1,075
- 10 to 14 minutes: 1,735
- 15 to 19 minutes: 3,257
- 20 to 24 minutes: 3,042
- 25 to 29 minutes: 2,172
- 30 to 34 minutes: 3,546
- 35 to 39 minutes: 1,333
- 40 to 44 minutes: 1,378
- 45 to 59 minutes: 3,079
- 60 to 89 minutes: 1,755
- 90 or more minutes: 374
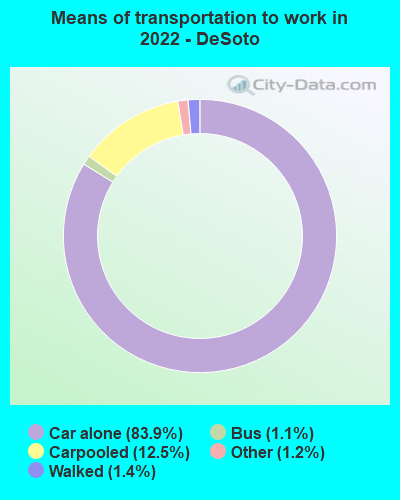
Means of transportation to work:
- Drove a car alone: 10,523 (62.7%)
- Carpooled: 1,607 (9.6%)
- Bus: 83 (0.5%)
- Taxi: 185 (1.1%)
- Walked: 192 (1.1%)
- Worked at home: 5,021 (29.9%)
- Unemployment by race in 2022
- Unemployment rate for White non-Hispanic residents
- 4.9%Females
- Unemployment rate for Black residents
- 9.7%Males
- 6.2%Females
- Unemployment rate for Asian residents
- 16.2%Males
- Unemployment rate for other race residents
- 1.2%Males
- Unemployment rate for two or more race residents
- 15.6%Males
- 1.2%Females
- Unemployment rate for Hispanic or Latino residents
- 9.0%Males

- Year of entry for the foreign-born population in DeSoto, Texas
- 4762010 or later
- 1,4482000 to 2009
- 6241990 to 1999
- 3261980 to 1989
- 3981970 to 1979
- 362Before 1970
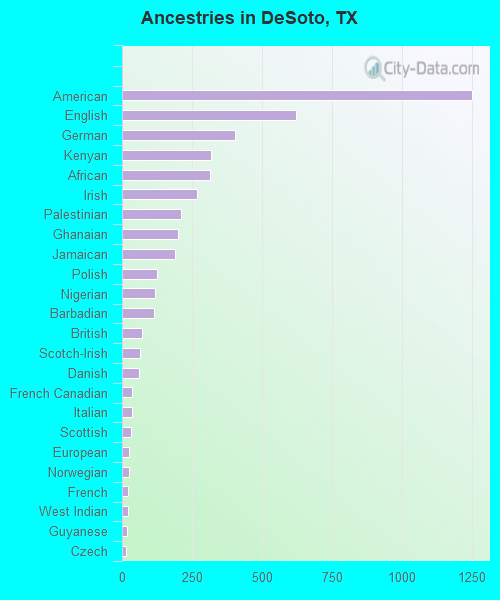
First ancestries reported:
- American: 1,250 (3.6%)
- English: 624 (1.8%)
- German: 405 (1.2%)
- Kenyan: 317 (0.9%)
- African: 314 (0.9%)
- Irish: 269 (0.8%)
- Palestinian: 211 (0.6%)
- Ghanaian: 201 (0.6%)
- Jamaican: 190 (0.5%)
- Polish: 124 (0.4%)
- Nigerian: 119 (0.3%)
- Barbadian: 114 (0.3%)
- British: 71 (0.2%)
- Scotch-Irish: 65 (0.2%)
- Danish: 60 (0.2%)
- French Canadian: 36 (0.1%)
- Italian: 34 (0.10%)
- Scottish: 33 (0.09%)
- European: 24 (0.07%)
- Norwegian: 24 (0.07%)
- French: 20 (0.06%)
- West Indian: 20 (0.06%)
- Guyanese: 19 (0.05%)
- Czech: 13 (0.04%)
- Belizean: 11 (0.03%)
- Russian: 8 (0.02%)
- Iranian: 7 (0.02%)
- Dutch: 6 (0.02%)
Most common places of birth for foreign-born residents (%):
| DeSoto: | 47.8% (1,983) |
| Texas: | 48.4% (2,411,723) |
| DeSoto: | 10.7% (445) |
| Texas: | 0.3% (13,034) |
| DeSoto: | 6.5% (268) |
| Texas: | 1.9% (96,110) |
| DeSoto: | 4.6% (190) |
| Texas: | 0.4% (20,458) |
| DeSoto: | 3.0% (125) |
| Texas: | 2.3% (115,558) |
| DeSoto: | 3.0% (124) |
| Texas: | 4.5% (224,455) |
| DeSoto: | 2.5% (105) |
| Texas: | 3.0% (147,182) |
| DeSoto: | 2.5% (104) |
| Texas: | 3.7% (184,770) |
| DeSoto: | 1.9% (78) |
| Texas: | 1.8% (87,382) |
| DeSoto: | 1.8% (76) |
| Texas: | 1.2% (61,555) |
| DeSoto: | 1.7% (70) |
| Texas: | 1.2% (60,172) |
| DeSoto: | 1.5% (64) |
| Texas: | 1.3% (62,978) |
Place of birth for U.S.-born residents:
- This state: 35,205
- Other state: 16,832
- Northeast: 1,498
- Midwest: 2,833
- South: 9,900
- West: 2,470
90.2% of DeSoto residents lived in the same house 1 years ago.
Out of people who lived in different houses, 39.1% lived in this county.
Out of people who lived in different counties, 64.0% lived in Texas.
| DeSoto: | 90.2% |
| State average: | 85.7% |
Education attainment for males 25 years and older:
- No schooling: 94
- Nursery to 4th grade: 130
- 5th and 6th grade: 328
- 7th and 8th grade: 72
- 9th grade: 180
- 10th grade: 371
- 11th grade: 122
- 12th grade, no diploma: 345
- High school graduate (or equivalency): 4,752
- Less than 1 year of college: 1,665
- Some college more than 1 year, no degree: 2,493
- Associate degree: 1,541
- Bachelor's degree: 2,905
- Master's degree: 1,325
- Professional school degree: 168
- Doctorate degree: 215

Education attainment for females 25 years and older:
- No schooling: 100
- Nursery to 4th grade: 19
- 5th and 6th grade: 258
- 7th and 8th grade: 37
- 9th grade: 310
- 10th grade: 79
- 11th grade: 189
- 12th grade, no diploma: 193
- High school graduate (or equivalency): 4,630
- Less than 1 year of college: 2,312
- Some college more than 1 year, no degree: 4,490
- Associate degree: 1,747
- Bachelor's degree: 3,746
- Master's degree: 3,135
- Professional school degree: 493
- Doctorate degree: 207


Housing units in structures:
- One, detached: 15,990
- One, attached: 638
- Two: 296
- 3 or 4: 799
- 5 to 9: 1,091
- 10 to 19: 1,569
- 20 to 49: 219
- 50 or more: 959
- Mobile homes: 505
Median worth of mobile homes: $29,758
Housing units lacking complete kitchen facilities in 2022: 1.6%
House/condo owner moved in on average 10 years ago
Renter moved in on average 5 years ago

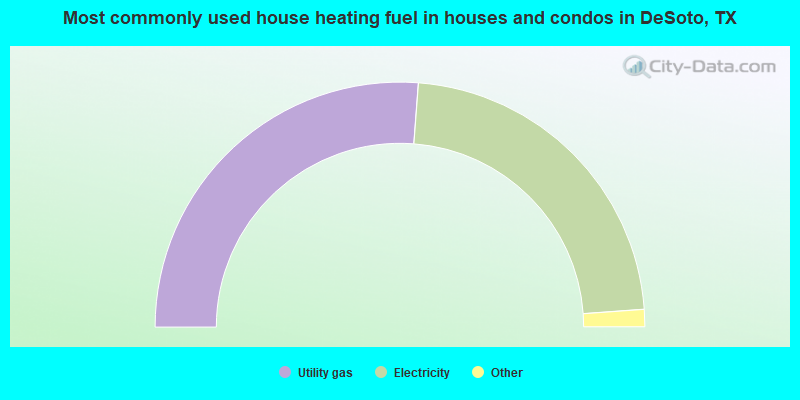
- 52.4%Utility gas
- 45.3%Electricity
- 1.5%Bottled, tank, or LP gas
- 0.7%No fuel used
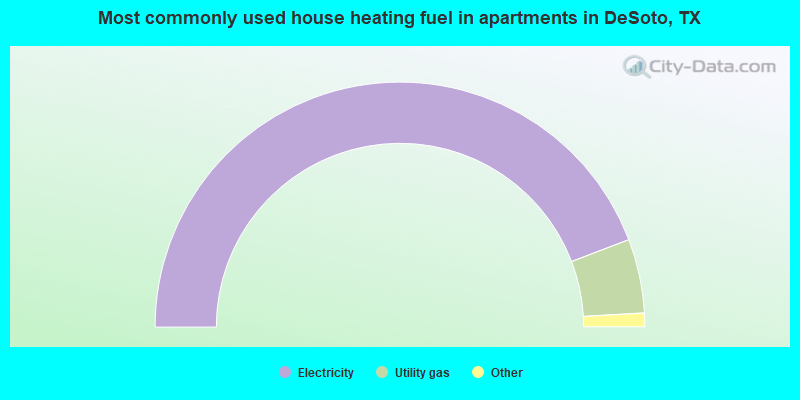
- 88.4%Electricity
- 9.8%Utility gas
- 1.1%Bottled, tank, or LP gas
- 0.7%No fuel used
Private vs. public school enrollment:
| Here: | 12.9% |
| Texas: | 8.8% |
| Here: | 13.2% |
| Texas: | 8.0% |
| Here: | 9.8% |
| Texas: | 16.2% |


